energy spectrum of carbon nanotube

Hi everyone, I am trying to use Kwant to calculate the band structure of a carbon nanotube. For example, I build a zigzag nanoribbon with translation symmetry (1,0). Then I add the hopping between the a and b sites at the ends of the ribbon by hand. This usually gives the correct nanotube spectrum in a tight-binding scheme. However, I got incorrect one using Kwant. I cannot figure out what is the missing part in the code. Could anyone help me out here? The following is the code, and in the attachments there are the graph of the system and also the incorrect spectrum given by Kwant.
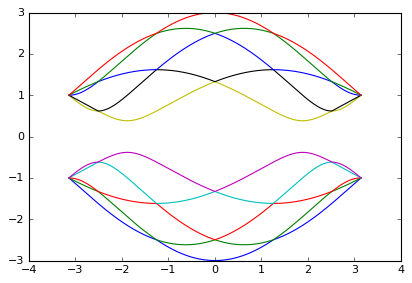
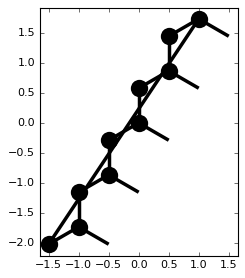
From the system plot, the a, b sites at the ends of the ribbon are indeed connected. The incorrect spectrum looks similar to the correct one, but for all the armchair nanotubes they should be metals not insulators.
Many thanks in advance! Best regards, Feng Liu import kwant import numpy as np from types import SimpleNamespace w=4 W=np.sqrt(3)*0.5*w+1/sqrt(3) #width of zigzag nanoribbon p = SimpleNamespace(t=1.0, mu = 0.0, B=0.0) def ribbon_shape(pos): return -W/2<= pos[1] < W/2 def onsite(site,p): (x,y)=site.pos return 0.0 def hopping(site1,site2,p): x1, y1 = site1.pos x2, y2 = site2.pos return p.t lat = kwant.lattice.honeycomb() a,b=lat.sublattices sym_sys = kwant.TranslationalSymmetry((1, 0)) sys = kwant.Builder(sym_sys) sys[lat.shape(ribbon_shape, (0, 0))] = onsite sys[lat.neighbors()] = hopping sys[a(0, w/2), b(0, -w/2-1)] = p.t #connect the ends kwant.plot(sys) sys=sys.finalized() kwant.plotter.bands(sys,args=[p],momenta=600)

Dear Liu Feng,
When you plot the lead cell, as you did it in your program, you can not see
if your system is exactly what you were expecting. So I suggest to you,in
order to see why you are getting a different spectrum then what you are
expecting, is to do the following:
1) define a central sytem.
2) attach the lead to this sytem.
3) plot the system with many cells of the lead by using the option
num_lead_cells:
kwant.plot(system, num_lead_cells=6)
This way, you will see that the links you put, do not define the nanotube
you had in mind.
Best regards,
Adel
On Thu, Oct 20, 2016 at 6:45 AM, Liu Feng
Hi everyone,
I am trying to use Kwant to calculate the band structure of a carbon nanotube.
For example, I build a zigzag nanoribbon with translation symmetry (1,0). Then I add the hopping between the a and b sites at the ends of the ribbon by hand. This usually gives the correct nanotube spectrum in a tight-binding scheme. However, I got incorrect one using Kwant. I cannot figure out what is the missing part in the code. Could anyone help me out here?
The following is the code, and in the attachments there are the graph of the system and also the incorrect spectrum given by Kwant.
From the system plot, the a, b sites at the ends of the ribbon are indeed connected. The incorrect spectrum looks similar to the correct one, but for all the armchair nanotubes they should be metals not insulators.
Many thanks in advance! Best regards, Feng Liu
import kwant import numpy as np from types import SimpleNamespace
w=4 W=np.sqrt(3)*0.5*w+1/sqrt(3) #width of zigzag nanoribbon p = SimpleNamespace(t=1.0, mu = 0.0, B=0.0)
def ribbon_shape(pos): return -W/2<= pos[1] < W/2
def onsite(site,p): (x,y)=site.pos return 0.0
def hopping(site1,site2,p): x1, y1 = site1.pos x2, y2 = site2.pos return p.t
lat = kwant.lattice.honeycomb()
a,b=lat.sublattices
sym_sys = kwant.TranslationalSymmetry((1, 0))
sys = kwant.Builder(sym_sys)
sys[lat.shape(ribbon_shape, (0, 0))] = onsite
sys[lat.neighbors()] = hopping
sys[a(0, w/2), b(0, -w/2-1)] = p.t #connect the ends
kwant.plot(sys)
sys=sys.finalized()
kwant.plotter.bands(sys,args=[p],momenta=600)
-- Abbout Adel
Dear Adel,
Many thanks for your kind suggestion.
Now I understand why I got the incorrect nanotube spectrum.
Indeed the hand-added hopping connects the undesired sites at the ends of
nanoribbon.
It seems by using the translational symmetry parameter, we
cannot have the correct periodic connection for armchair nanotubes by the
default configuration of honeycomb lattice (Although I can get correct
energy spectra for zigzag nanotubes in this case).
Do you have any ideas of properly defining the primitive vectors
and translational symmetry for armchair nanotubes?
Of course, one can build a proper tight-binding model defining
sites one by one with Bloch phase as an extra parameter without using
Translational parameters. But I feel this method is a little bit
troublesome...
Many thanks,
feng
Abbout Adel
From the system plot, the a, b sites at the ends of the ribbon are indeed connected. The incorrect spectrum looks similar to the correct one, but for all the armchair nanotubes they should be metals not insulators.
Many thanks in advance! Best regards, Feng Liu import kwant import numpy as np from types import SimpleNamespace w=4 W=np.sqrt(3)*0.5*w+1/sqrt(3) #width of zigzag nanoribbon p = SimpleNamespace(t=1.0, mu = 0.0, B=0.0) def ribbon_shape(pos): return -W/2<= pos[1] < W/2 def onsite(site,p): (x,y)=site.pos return 0.0 def hopping(site1,site2,p): x1, y1 = site1.pos x2, y2 = site2.pos return p.t lat = kwant.lattice.honeycomb() a,b=lat.sublattices sym_sys = kwant.TranslationalSymmetry((1, 0)) sys = kwant.Builder(sym_sys) sys[lat.shape(ribbon_shape, (0, 0))] = onsite sys[lat.neighbors()] = hopping sys[a(0, w/2), b(0, -w/2-1)] = p.t #connect the ends kwant.plot(sys) sys=sys.finalized() kwant.plotter.bands(sys,args=[p],momenta=600) -- Abbout Adel

When you are connecting the edges you have to use proper lattice index.
Here is a working example for armchair (V1.0.1).
from math import sqrt
import kwant
from matplotlib import pyplot
# Define the graphene lattice
sin_30, cos_30 = (1 / 2., sqrt(3) / 2.)
#armchair
graphene = kwant.lattice.general([(0, 1), (cos_30, sin_30)],
[(0, 0), (1 / sqrt(3), 0)])
a, b = graphene.sublattices
hoppings = (((0, 0), a, b), ((0, 1), a, b), ((-1, 1), a, b))
def aclead(w, onsite=0,t=-1):
sym = kwant.TranslationalSymmetry(graphene.vec((-1,2)))
def lead0_shape(pos):
x, y = pos
return 0<=y

Abbout Adel wrote:
When you plot the lead cell, as you did it in your program, you can not see if your system is exactly what you were expecting. So I suggest to you,in order to see why you are getting a different spectrum then what you are expecting, is to do the following:
1) define a central sytem. 2) attach the lead to this sytem. 3) plot the system with many cells of the lead by using the option num_lead_cells: kwant.plot(system, num_lead_cells=6)
The system plotter should probably honor num_lead_cells also when plotting a simple “detached” lead. Thanks for reminding me of this deficiency! I've made an issue in the bugtracker for this [1]. By the way, please do feel free to file such issues yourself. (We can always close them if we don’t like them.) And, you know, you are more than welcome to work on some of the issues, if you like. :-) [1] https://gitlab.kwant-project.org/kwant/kwant/issues/60
participants (4)
-
 Abbout Adel
 -
 Christoph Groth
 -
 Liu Feng
 -
 Sumit Ghosh