discontinuity between lead and scattering region

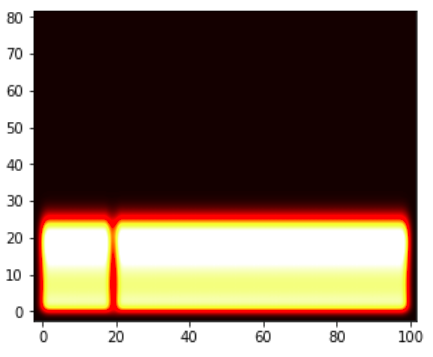
Dear KWANT Developers, I am trying to plot the current density. The procedure is straightforward. I have attached leads to the scattering region (leads have same onsite and hopping as of the scattering region) as *sys[(lat(z,y,x) for z in range(H) for y in range(W)for x in range(L))]=onsitesys[kwant.builder.HoppingKind((1, 0, 0), lat, lat)] = hoppingzsys[kwant.builder.HoppingKind((0, 1, 0), lat, lat)] = hoppingysys[kwant.builder.HoppingKind((0, 0, 1), lat, lat)] = hoppingxlead=kwant.Builder(kwant.TranslationalSymmetry((1,0,0)))lead[(lat(z,y,x) for z in range(H) for y in range(W)for x in range(L))]=onsitelead[kwant.builder.HoppingKind((1, 0, 0), lat, lat)] = hoppingzlead[kwant.builder.HoppingKind((0, 1, 0), lat, lat)] = hoppingylead[kwant.builder.HoppingKind((0, 0, 1), lat, lat)] = hoppingxsys.attach_lead(lead, add_cells=80)sys.attach_lead(lead.reversed())* [image: image.png] As you can see from the plot there is a discontinuity in the plot at (W=20). Why it is so even if the scattering region and leads have same onsite and hopping and there is translation symmetry throughout ? -- Best Regards, Naveen Yadav Research Scholar Department of Physics & Astrophysics University Of Delhi New Delhi-110007

Dear Naveen, What you get is what is expected. You do not have translational symmetry. Rewrite your code by keeping only two dimensions and you will see why. I hope this helps, Adel On Thu, May 7, 2020 at 12:52 PM Naveen Yadav <naveengunwal72@gmail.com> wrote:
Dear KWANT Developers, I am trying to plot the current density. The procedure is straightforward. I have attached leads to the scattering region (leads have same onsite and hopping as of the scattering region) as
*sys[(lat(z,y,x) for z in range(H) for y in range(W)for x in range(L))]=onsitesys[kwant.builder.HoppingKind((1, 0, 0), lat, lat)] = hoppingzsys[kwant.builder.HoppingKind((0, 1, 0), lat, lat)] = hoppingysys[kwant.builder.HoppingKind((0, 0, 1), lat, lat)] = hoppingxlead=kwant.Builder(kwant.TranslationalSymmetry((1,0,0)))lead[(lat(z,y,x) for z in range(H) for y in range(W)for x in range(L))]=onsitelead[kwant.builder.HoppingKind((1, 0, 0), lat, lat)] = hoppingzlead[kwant.builder.HoppingKind((0, 1, 0), lat, lat)] = hoppingylead[kwant.builder.HoppingKind((0, 0, 1), lat, lat)] = hoppingxsys.attach_lead(lead, add_cells=80)sys.attach_lead(lead.reversed())* [image: image.png] As you can see from the plot there is a discontinuity in the plot at (W=20). Why it is so even if the scattering region and leads have same onsite and hopping and there is translation symmetry throughout ?
-- Best Regards, Naveen Yadav Research Scholar Department of Physics & Astrophysics University Of Delhi New Delhi-110007
-- Abbout Adel
Dear sir, I understand what you have said. But how can I maintain translation symmetry ?because my system is 3D and for plotting current I access the sites of 3D system using *list(sys.sites) *and plot the current for 2D slice. Please suggest me. Best Regards Naveen Yadav Research Scholar Department of Physics & Astrophysics University of Delhi New Delhi-110007 On Thu, May 7, 2020, 19:06 Abbout Adel <abbout.adel@gmail.com> wrote:
Dear Naveen,
What you get is what is expected. You do not have translational symmetry. Rewrite your code by keeping only two dimensions and you will see why.
I hope this helps, Adel
On Thu, May 7, 2020 at 12:52 PM Naveen Yadav <naveengunwal72@gmail.com> wrote:
Dear KWANT Developers, I am trying to plot the current density. The procedure is straightforward. I have attached leads to the scattering region (leads have same onsite and hopping as of the scattering region) as
*sys[(lat(z,y,x) for z in range(H) for y in range(W)for x in range(L))]=onsitesys[kwant.builder.HoppingKind((1, 0, 0), lat, lat)] = hoppingzsys[kwant.builder.HoppingKind((0, 1, 0), lat, lat)] = hoppingysys[kwant.builder.HoppingKind((0, 0, 1), lat, lat)] = hoppingxlead=kwant.Builder(kwant.TranslationalSymmetry((1,0,0)))lead[(lat(z,y,x) for z in range(H) for y in range(W)for x in range(L))]=onsitelead[kwant.builder.HoppingKind((1, 0, 0), lat, lat)] = hoppingzlead[kwant.builder.HoppingKind((0, 1, 0), lat, lat)] = hoppingylead[kwant.builder.HoppingKind((0, 0, 1), lat, lat)] = hoppingxsys.attach_lead(lead, add_cells=80)sys.attach_lead(lead.reversed())* [image: image.png] As you can see from the plot there is a discontinuity in the plot at (W=20). Why it is so even if the scattering region and leads have same onsite and hopping and there is translation symmetry throughout ?
-- Best Regards, Naveen Yadav Research Scholar Department of Physics & Astrophysics University Of Delhi New Delhi-110007
-- Abbout Adel
Hi again, I f you want translational symmetry, you need to use wraparound module and you will need to find your result only on one unit cell. You will have also to do integration on the Brillouin zone. I hope this helps Adel On Thu, May 7, 2020 at 5:12 PM Naveen Yadav <naveengunwal72@gmail.com> wrote:
Dear sir, I understand what you have said. But how can I maintain translation symmetry ?because my system is 3D and for plotting current I access the sites of 3D system using *list(sys.sites) *and plot the current for 2D slice. Please suggest me.
Best Regards Naveen Yadav Research Scholar Department of Physics & Astrophysics University of Delhi New Delhi-110007
On Thu, May 7, 2020, 19:06 Abbout Adel <abbout.adel@gmail.com> wrote:
Dear Naveen,
What you get is what is expected. You do not have translational symmetry. Rewrite your code by keeping only two dimensions and you will see why.
I hope this helps, Adel
On Thu, May 7, 2020 at 12:52 PM Naveen Yadav <naveengunwal72@gmail.com> wrote:
Dear KWANT Developers, I am trying to plot the current density. The procedure is straightforward. I have attached leads to the scattering region (leads have same onsite and hopping as of the scattering region) as
*sys[(lat(z,y,x) for z in range(H) for y in range(W)for x in range(L))]=onsitesys[kwant.builder.HoppingKind((1, 0, 0), lat, lat)] = hoppingzsys[kwant.builder.HoppingKind((0, 1, 0), lat, lat)] = hoppingysys[kwant.builder.HoppingKind((0, 0, 1), lat, lat)] = hoppingxlead=kwant.Builder(kwant.TranslationalSymmetry((1,0,0)))lead[(lat(z,y,x) for z in range(H) for y in range(W)for x in range(L))]=onsitelead[kwant.builder.HoppingKind((1, 0, 0), lat, lat)] = hoppingzlead[kwant.builder.HoppingKind((0, 1, 0), lat, lat)] = hoppingylead[kwant.builder.HoppingKind((0, 0, 1), lat, lat)] = hoppingxsys.attach_lead(lead, add_cells=80)sys.attach_lead(lead.reversed())* [image: image.png] As you can see from the plot there is a discontinuity in the plot at (W=20). Why it is so even if the scattering region and leads have same onsite and hopping and there is translation symmetry throughout ?
-- Best Regards, Naveen Yadav Research Scholar Department of Physics & Astrophysics University Of Delhi New Delhi-110007
-- Abbout Adel
-- Abbout Adel
Dear sir, Could you please provide me an working example of this type? Best Regards Naveen Yadav Research Scholar Department of Physics & Astrophysics University of Delhi New Delhi-110007 On Thu, May 7, 2020, 20:37 Abbout Adel <abbout.adel@gmail.com> wrote:
Hi again,
I f you want translational symmetry, you need to use wraparound module and you will need to find your result only on one unit cell. You will have also to do integration on the Brillouin zone.
I hope this helps Adel
On Thu, May 7, 2020 at 5:12 PM Naveen Yadav <naveengunwal72@gmail.com> wrote:
Dear sir, I understand what you have said. But how can I maintain translation symmetry ?because my system is 3D and for plotting current I access the sites of 3D system using *list(sys.sites) *and plot the current for 2D slice. Please suggest me.
Best Regards Naveen Yadav Research Scholar Department of Physics & Astrophysics University of Delhi New Delhi-110007
On Thu, May 7, 2020, 19:06 Abbout Adel <abbout.adel@gmail.com> wrote:
Dear Naveen,
What you get is what is expected. You do not have translational symmetry. Rewrite your code by keeping only two dimensions and you will see why.
I hope this helps, Adel
On Thu, May 7, 2020 at 12:52 PM Naveen Yadav <naveengunwal72@gmail.com> wrote:
Dear KWANT Developers, I am trying to plot the current density. The procedure is straightforward. I have attached leads to the scattering region (leads have same onsite and hopping as of the scattering region) as
*sys[(lat(z,y,x) for z in range(H) for y in range(W)for x in range(L))]=onsitesys[kwant.builder.HoppingKind((1, 0, 0), lat, lat)] = hoppingzsys[kwant.builder.HoppingKind((0, 1, 0), lat, lat)] = hoppingysys[kwant.builder.HoppingKind((0, 0, 1), lat, lat)] = hoppingxlead=kwant.Builder(kwant.TranslationalSymmetry((1,0,0)))lead[(lat(z,y,x) for z in range(H) for y in range(W)for x in range(L))]=onsitelead[kwant.builder.HoppingKind((1, 0, 0), lat, lat)] = hoppingzlead[kwant.builder.HoppingKind((0, 1, 0), lat, lat)] = hoppingylead[kwant.builder.HoppingKind((0, 0, 1), lat, lat)] = hoppingxsys.attach_lead(lead, add_cells=80)sys.attach_lead(lead.reversed())* [image: image.png] As you can see from the plot there is a discontinuity in the plot at (W=20). Why it is so even if the scattering region and leads have same onsite and hopping and there is translation symmetry throughout ?
-- Best Regards, Naveen Yadav Research Scholar Department of Physics & Astrophysics University Of Delhi New Delhi-110007
-- Abbout Adel
-- Abbout Adel
Sorry, Naveen. I don't have an example ready to use. The idea behind is that the wraparound module helps you in getting the homiltonian for each K point: H(kx,ky,kz) Diagonalizing it will give you E(kx,ky,kz) which means a point (or few points for a multiband system) the eigenvectors will help you to calculate the density for a given mode. I hope this helps, Adel On Thu, May 7, 2020 at 9:46 PM Naveen Yadav <naveengunwal72@gmail.com> wrote:
Dear sir, Could you please provide me an working example of this type?
Best Regards Naveen Yadav Research Scholar Department of Physics & Astrophysics University of Delhi New Delhi-110007
On Thu, May 7, 2020, 20:37 Abbout Adel <abbout.adel@gmail.com> wrote:
Hi again,
I f you want translational symmetry, you need to use wraparound module and you will need to find your result only on one unit cell. You will have also to do integration on the Brillouin zone.
I hope this helps Adel
On Thu, May 7, 2020 at 5:12 PM Naveen Yadav <naveengunwal72@gmail.com> wrote:
Dear sir, I understand what you have said. But how can I maintain translation symmetry ?because my system is 3D and for plotting current I access the sites of 3D system using *list(sys.sites) *and plot the current for 2D slice. Please suggest me.
Best Regards Naveen Yadav Research Scholar Department of Physics & Astrophysics University of Delhi New Delhi-110007
On Thu, May 7, 2020, 19:06 Abbout Adel <abbout.adel@gmail.com> wrote:
Dear Naveen,
What you get is what is expected. You do not have translational symmetry. Rewrite your code by keeping only two dimensions and you will see why.
I hope this helps, Adel
On Thu, May 7, 2020 at 12:52 PM Naveen Yadav <naveengunwal72@gmail.com> wrote:
Dear KWANT Developers, I am trying to plot the current density. The procedure is straightforward. I have attached leads to the scattering region (leads have same onsite and hopping as of the scattering region) as
*sys[(lat(z,y,x) for z in range(H) for y in range(W)for x in range(L))]=onsitesys[kwant.builder.HoppingKind((1, 0, 0), lat, lat)] = hoppingzsys[kwant.builder.HoppingKind((0, 1, 0), lat, lat)] = hoppingysys[kwant.builder.HoppingKind((0, 0, 1), lat, lat)] = hoppingxlead=kwant.Builder(kwant.TranslationalSymmetry((1,0,0)))lead[(lat(z,y,x) for z in range(H) for y in range(W)for x in range(L))]=onsitelead[kwant.builder.HoppingKind((1, 0, 0), lat, lat)] = hoppingzlead[kwant.builder.HoppingKind((0, 1, 0), lat, lat)] = hoppingylead[kwant.builder.HoppingKind((0, 0, 1), lat, lat)] = hoppingxsys.attach_lead(lead, add_cells=80)sys.attach_lead(lead.reversed())* [image: image.png] As you can see from the plot there is a discontinuity in the plot at (W=20). Why it is so even if the scattering region and leads have same onsite and hopping and there is translation symmetry throughout ?
-- Best Regards, Naveen Yadav Research Scholar Department of Physics & Astrophysics University Of Delhi New Delhi-110007
-- Abbout Adel
-- Abbout Adel
-- Abbout Adel
Dear sir, As you said I tried the wraparound module but I got errors while diagonalizing the system. I don't know how to use this module for 3D system. Please help. The code is attached below UserCodeError: Error occurred in user-supplied value function "f". See the upper part of the above backtrace for more information. sys=kwant.Builder(kwant.TranslationalSymmetry((0,0,-1))) lat=kwant.lattice.cubic(norbs=2) sys[(lat(x,y,0) for x in range(L) for y in range(W))]=onsite sys[kwant.builder.HoppingKind((1, 0, 0), lat, lat)] = hoppingx sys[kwant.builder.HoppingKind((0, 1, 0), lat, lat)] = hoppingy sys[kwant.builder.HoppingKind((0, 0, 1), lat, lat)] = hoppingz #lead=kwant.Builder(kwant.TranslationalSymmetry((0,0,-1))) #lead[(lat(x,y,z) for x in range(L) for y in range(W)for z in range(H))]=onsite #lead[kwant.builder.HoppingKind((1, 0, 0), lat, lat)] = hoppingx #lead[kwant.builder.HoppingKind((0, 1, 0), lat, lat)] = hoppingy #lead[kwant.builder.HoppingKind((0, 0, 1), lat, lat)] = hoppingz #sys.attach_lead(lead) #sys.attach_lead(lead.reversed()) sys = kwant.wraparound.wraparound(sys, keep=None) kwant.plot(sys) sysf=sys.finalized() ham_mat = sysf.hamiltonian_submatrix() ev = sla.eigsh(ham_mat, k=31, which='SM') evecs = ev[1] prob_dens = np.abs(evecs[:, 30])**2 #print(prob_dens) #Sites=list(sysf.sites) #rho = kwant.operator.Density(sysf) #density = rho(psi) #wf_sqr = sum(rho(psi) for psi in wf(0)) On Fri, May 8, 2020 at 3:30 AM Abbout Adel <abbout.adel@gmail.com> wrote:
Sorry, Naveen. I don't have an example ready to use.
The idea behind is that the wraparound module helps you in getting the homiltonian for each K point: H(kx,ky,kz)
Diagonalizing it will give you E(kx,ky,kz) which means a point (or few points for a multiband system) the eigenvectors will help you to calculate the density for a given mode.
I hope this helps,
Adel
On Thu, May 7, 2020 at 9:46 PM Naveen Yadav <naveengunwal72@gmail.com> wrote:
Dear sir, Could you please provide me an working example of this type?
Best Regards Naveen Yadav Research Scholar Department of Physics & Astrophysics University of Delhi New Delhi-110007
On Thu, May 7, 2020, 20:37 Abbout Adel <abbout.adel@gmail.com> wrote:
Hi again,
I f you want translational symmetry, you need to use wraparound module and you will need to find your result only on one unit cell. You will have also to do integration on the Brillouin zone.
I hope this helps Adel
On Thu, May 7, 2020 at 5:12 PM Naveen Yadav <naveengunwal72@gmail.com> wrote:
Dear sir, I understand what you have said. But how can I maintain translation symmetry ?because my system is 3D and for plotting current I access the sites of 3D system using *list(sys.sites) *and plot the current for 2D slice. Please suggest me.
Best Regards Naveen Yadav Research Scholar Department of Physics & Astrophysics University of Delhi New Delhi-110007
On Thu, May 7, 2020, 19:06 Abbout Adel <abbout.adel@gmail.com> wrote:
Dear Naveen,
What you get is what is expected. You do not have translational symmetry. Rewrite your code by keeping only two dimensions and you will see why.
I hope this helps, Adel
On Thu, May 7, 2020 at 12:52 PM Naveen Yadav <naveengunwal72@gmail.com> wrote:
Dear KWANT Developers, I am trying to plot the current density. The procedure is straightforward. I have attached leads to the scattering region (leads have same onsite and hopping as of the scattering region) as
*sys[(lat(z,y,x) for z in range(H) for y in range(W)for x in range(L))]=onsitesys[kwant.builder.HoppingKind((1, 0, 0), lat, lat)] = hoppingzsys[kwant.builder.HoppingKind((0, 1, 0), lat, lat)] = hoppingysys[kwant.builder.HoppingKind((0, 0, 1), lat, lat)] = hoppingxlead=kwant.Builder(kwant.TranslationalSymmetry((1,0,0)))lead[(lat(z,y,x) for z in range(H) for y in range(W)for x in range(L))]=onsitelead[kwant.builder.HoppingKind((1, 0, 0), lat, lat)] = hoppingzlead[kwant.builder.HoppingKind((0, 1, 0), lat, lat)] = hoppingylead[kwant.builder.HoppingKind((0, 0, 1), lat, lat)] = hoppingxsys.attach_lead(lead, add_cells=80)sys.attach_lead(lead.reversed())* [image: image.png] As you can see from the plot there is a discontinuity in the plot at (W=20). Why it is so even if the scattering region and leads have same onsite and hopping and there is translation symmetry throughout ?
-- Best Regards, Naveen Yadav Research Scholar Department of Physics & Astrophysics University Of Delhi New Delhi-110007
-- Abbout Adel
-- Abbout Adel
-- Abbout Adel
-- Best Regards, Naveen Yadav Research Scholar Department of Physics & Astrophysics University Of Delhi New Delhi-110007
Dear Naveen, You can do it the way explained below. (probably a small change may be done if the vectors of the lattice are not orthogonal) I hope this helps, Adel import numpyfrom kwant.wraparound import wraparound,plot_2d_bandsfrom matplotlib import pyplotget_ipython().magic('matplotlib inline')import sysimport itertoolsimport collectionsimport cmathimport numpy as npimport tinyarray as tafrom numpy import pi,sqrt,arccos,arrayimport kwantfrom kwant.builder import herm_conj def plot_bands_2d(syst, args=(), momenta=(31, 31, 31), kz=0): """Plot the bands of a system with two wrapped-around symmetries.""" from mpl_toolkits.mplot3d import Axes3D from matplotlib import pyplot if not isinstance(syst, kwant.system.FiniteSystem): raise TypeError("Need a system without symmetries.") fig = pyplot.figure() ax = fig.gca(projection='3d') kxs = np.linspace(-np.pi, np.pi, momenta[0]) kys = np.linspace(-np.pi, np.pi , momenta[1]) def get_energies(kz=kz): energies = [[np.sort(np.linalg. eigvalsh(syst.hamiltonian_submatrix( args + (kx, ky, kz), sparse=False)). real) for ky in kys] for kx in kxs] return energies energies = np.array( get_energies(kz=kz)) Colors=['orange','g','b','r','y'] mesh_x, mesh_y = np. meshgrid(kxs, kys) for i in range(energies.shape[-1]): ax.plot_wireframe( mesh_x, mesh_y, energies[:, :, i], rstride=1, cstride=1,color=Colors[i]) ax. plot_surface(mesh_x, mesh_y, energies[:, :, i], rstride=1, cstride=1,color= Colors[i]) #pyplot.show() def make_sys(): def Onsite(site): return array([[1 ,1],[1,-1]]) """Create a builder for a periodic infinite sheet of graphene.""" lat =kwant.lattice.cubic(norbs=2) sym = kwant. TranslationalSymmetry(lat.vec((1, 0,0)), lat.vec((0, 1,0)),lat.vec((0, 0,1 ))) syst = kwant.Builder(sym) syst[lat.shape(lambda p: True, (0, 0, 0))] = Onsite syst[lat.neighbors()] = array([[1,1j],[-1j,1]]) return syst sys=make_sys()syst = wraparound(sys).finalized() plot_bands_2d(syst,kz=-3) ######################################### On Sun, May 17, 2020 at 8:10 PM Naveen Yadav <naveengunwal72@gmail.com> wrote:
Dear sir, As you said I tried the wraparound module but I got errors while diagonalizing the system. I don't know how to use this module for 3D system. Please help. The code is attached below
UserCodeError: Error occurred in user-supplied value function "f". See the upper part of the above backtrace for more information.
sys=kwant.Builder(kwant.TranslationalSymmetry((0,0,-1))) lat=kwant.lattice.cubic(norbs=2) sys[(lat(x,y,0) for x in range(L) for y in range(W))]=onsite sys[kwant.builder.HoppingKind((1, 0, 0), lat, lat)] = hoppingx sys[kwant.builder.HoppingKind((0, 1, 0), lat, lat)] = hoppingy sys[kwant.builder.HoppingKind((0, 0, 1), lat, lat)] = hoppingz
#lead=kwant.Builder(kwant.TranslationalSymmetry((0,0,-1))) #lead[(lat(x,y,z) for x in range(L) for y in range(W)for z in range(H))]=onsite #lead[kwant.builder.HoppingKind((1, 0, 0), lat, lat)] = hoppingx #lead[kwant.builder.HoppingKind((0, 1, 0), lat, lat)] = hoppingy #lead[kwant.builder.HoppingKind((0, 0, 1), lat, lat)] = hoppingz #sys.attach_lead(lead) #sys.attach_lead(lead.reversed()) sys = kwant.wraparound.wraparound(sys, keep=None) kwant.plot(sys) sysf=sys.finalized() ham_mat = sysf.hamiltonian_submatrix() ev = sla.eigsh(ham_mat, k=31, which='SM') evecs = ev[1] prob_dens = np.abs(evecs[:, 30])**2 #print(prob_dens) #Sites=list(sysf.sites) #rho = kwant.operator.Density(sysf) #density = rho(psi) #wf_sqr = sum(rho(psi) for psi in wf(0))
On Fri, May 8, 2020 at 3:30 AM Abbout Adel <abbout.adel@gmail.com> wrote:
Sorry, Naveen. I don't have an example ready to use.
The idea behind is that the wraparound module helps you in getting the homiltonian for each K point: H(kx,ky,kz)
Diagonalizing it will give you E(kx,ky,kz) which means a point (or few points for a multiband system) the eigenvectors will help you to calculate the density for a given mode.
I hope this helps,
Adel
On Thu, May 7, 2020 at 9:46 PM Naveen Yadav <naveengunwal72@gmail.com> wrote:
Dear sir, Could you please provide me an working example of this type?
Best Regards Naveen Yadav Research Scholar Department of Physics & Astrophysics University of Delhi New Delhi-110007
On Thu, May 7, 2020, 20:37 Abbout Adel <abbout.adel@gmail.com> wrote:
Hi again,
I f you want translational symmetry, you need to use wraparound module and you will need to find your result only on one unit cell. You will have also to do integration on the Brillouin zone.
I hope this helps Adel
On Thu, May 7, 2020 at 5:12 PM Naveen Yadav <naveengunwal72@gmail.com> wrote:
Dear sir, I understand what you have said. But how can I maintain translation symmetry ?because my system is 3D and for plotting current I access the sites of 3D system using *list(sys.sites) *and plot the current for 2D slice. Please suggest me.
Best Regards Naveen Yadav Research Scholar Department of Physics & Astrophysics University of Delhi New Delhi-110007
On Thu, May 7, 2020, 19:06 Abbout Adel <abbout.adel@gmail.com> wrote:
Dear Naveen,
What you get is what is expected. You do not have translational symmetry. Rewrite your code by keeping only two dimensions and you will see why.
I hope this helps, Adel
On Thu, May 7, 2020 at 12:52 PM Naveen Yadav < naveengunwal72@gmail.com> wrote:
> Dear KWANT Developers, > I am trying to plot the current density. The procedure is > straightforward. I have attached leads to the scattering region (leads have > same onsite and hopping as of the scattering region) as > > > > > > > > > > > > *sys[(lat(z,y,x) for z in range(H) for y in range(W)for x in > range(L))]=onsitesys[kwant.builder.HoppingKind((1, 0, 0), lat, lat)] = > hoppingzsys[kwant.builder.HoppingKind((0, 1, 0), lat, lat)] = > hoppingysys[kwant.builder.HoppingKind((0, 0, 1), lat, lat)] = > hoppingxlead=kwant.Builder(kwant.TranslationalSymmetry((1,0,0)))lead[(lat(z,y,x) > for z in range(H) for y in range(W)for x in > range(L))]=onsitelead[kwant.builder.HoppingKind((1, 0, 0), lat, lat)] = > hoppingzlead[kwant.builder.HoppingKind((0, 1, 0), lat, lat)] = > hoppingylead[kwant.builder.HoppingKind((0, 0, 1), lat, lat)] = > hoppingxsys.attach_lead(lead, add_cells=80)sys.attach_lead(lead.reversed())* > [image: image.png] > As you can see from the plot there is a discontinuity in the plot at > (W=20). Why it is so even if the scattering region and leads have same > onsite and hopping and there is translation symmetry throughout ? > > -- > Best Regards, > Naveen Yadav > Research Scholar > Department of Physics & Astrophysics > University Of Delhi > New Delhi-110007 >
-- Abbout Adel
-- Abbout Adel
-- Abbout Adel
-- Best Regards, Naveen Yadav Research Scholar Department of Physics & Astrophysics University Of Delhi New Delhi-110007
-- Abbout Adel
Sorry, my code was not formatted correctly in my previous email. Here it is again: ############### import numpy from kwant.wraparound import wraparound,plot_2d_bands from matplotlib import pyplot get_ipython().magic('matplotlib inline') import sys import itertools import collections import cmath import numpy as np import tinyarray as ta from numpy import pi,sqrt,arccos,array import kwant from kwant.builder import herm_conj def plot_bands_2d(syst, args=(), momenta=(31, 31, 31), kz=0): """Plot the bands of a system with two wrapped-around symmetries.""" from mpl_toolkits.mplot3d import Axes3D from matplotlib import pyplot if not isinstance(syst, kwant.system.FiniteSystem): raise TypeError("Need a system without symmetries.") fig = pyplot.figure() ax = fig.gca(projection='3d') kxs = np.linspace(-np.pi, np.pi, momenta[0]) kys = np.linspace(-np.pi, np.pi, momenta[1]) def get_energies(kz=kz): energies = [[np.sort(np.linalg.eigvalsh(syst.hamiltonian_submatrix( args + (kx, ky, kz), sparse=False)).real) for ky in kys] for kx in kxs] return energies energies = np.array(get_energies(kz=kz)) Colors=['orange','g','b','r','y'] mesh_x, mesh_y = np.meshgrid(kxs, kys) for i in range(energies.shape[-1]): ax.plot_wireframe(mesh_x, mesh_y, energies[:, :, i], rstride=1, cstride=1,color=Colors[i]) ax.plot_surface(mesh_x, mesh_y, energies[:, :, i], rstride=1, cstride=1,color=Colors[i]) #pyplot.show() def make_sys(): def Onsite(site): return array([[1,1],[1,-1]]) """Create a builder for a periodic infinite sheet of graphene.""" lat =kwant.lattice.cubic(norbs=2) sym = kwant.TranslationalSymmetry(lat.vec((1, 0,0)), lat.vec((0, 1,0)),lat.vec((0, 0,1))) syst = kwant.Builder(sym) syst[lat.shape(lambda p: True, (0, 0, 0))] = Onsite syst[lat.neighbors()] = array([[1,1j],[-1j,1]]) return syst sys=make_sys() syst = wraparound(sys).finalized() plot_bands_2d(syst,kz=-3)
participants (3)
-
 Abbout Adel
 -
abbout.adel@gmail.com
-
 Naveen Yadav