
Hello everyone, Following this question <https://stackoverflow.com/q/53126305/4999991>, I'm convinced that numpy ndarrays are not MATLAB/mathematical multidimentional matrices and I should stop expecting them to be. However I still think it would have a lot of benefit to have a function like sympy's pprint to pretty print. something like pandas .head and .tail method plus .left .right .UpLeft .UpRight .DownLeft .DownRight methods. when nothing mentioned it would show 4 corners and put dots in the middle if the array is to big for the terminal. Best, Foad

Foad, Visualizing data is definitely a complex field. I definitely feel your pain. Printing your data is but one way of visualizing it, and probably only useful for very small and constrained datasets. Have you looked into set_printoptions <https://docs.scipy.org/doc/numpy-1.15.1/reference/generated/numpy.set_printoptions.html> to see how numpy’s existing capabilities might help you with your visualization? The code you showed seems quite good. I wouldn’t worry about performance when it comes to functions that will seldom be called in tight loops. As you’ll learn more about python and numpy, you’ll keep expanding it to include more use cases. For many of my projects, I create small submodules for visualization tailored to the specific needs of the particular project. I’ll try to incorporate your functions and see how I use them. Your original post seems to have some confusion about C Style vs F Style ordering. I hope that has been resolved. There is also a lot of good documentation https://docs.scipy.org/doc/numpy/user/numpy-for-matlab-users.html#numpy-for-... about transitioning from matlab. Mark On Mon, Nov 5, 2018 at 4:46 PM Foad Sojoodi Farimani <f.s.farimani@gmail.com> wrote:
Hello everyone,
Following this question <https://stackoverflow.com/q/53126305/4999991>, I'm convinced that numpy ndarrays are not MATLAB/mathematical multidimentional matrices and I should stop expecting them to be. However I still think it would have a lot of benefit to have a function like sympy's pprint to pretty print. something like pandas .head and .tail method plus .left .right .UpLeft .UpRight .DownLeft .DownRight methods. when nothing mentioned it would show 4 corners and put dots in the middle if the array is to big for the terminal.
Best, Foad _______________________________________________ NumPy-Discussion mailing list NumPy-Discussion@python.org https://mail.python.org/mailman/listinfo/numpy-discussion

Hijacking this thread while on the topic of pprint - we might want to look into a table-based `_html_repr_` or `_latex_repr_` for use in ipython - where we can print the full array and let scrollbars replace ellipses. Eric On Mon, 5 Nov 2018 at 21:11 Mark Harfouche <mark.harfouche@gmail.com> wrote:
Foad,
Visualizing data is definitely a complex field. I definitely feel your pain. Printing your data is but one way of visualizing it, and probably only useful for very small and constrained datasets. Have you looked into set_printoptions <https://docs.scipy.org/doc/numpy-1.15.1/reference/generated/numpy.set_printoptions.html> to see how numpy’s existing capabilities might help you with your visualization?
The code you showed seems quite good. I wouldn’t worry about performance when it comes to functions that will seldom be called in tight loops. As you’ll learn more about python and numpy, you’ll keep expanding it to include more use cases. For many of my projects, I create small submodules for visualization tailored to the specific needs of the particular project. I’ll try to incorporate your functions and see how I use them.
Your original post seems to have some confusion about C Style vs F Style ordering. I hope that has been resolved. There is also a lot of good documentation
https://docs.scipy.org/doc/numpy/user/numpy-for-matlab-users.html#numpy-for-... about transitioning from matlab.
Mark
On Mon, Nov 5, 2018 at 4:46 PM Foad Sojoodi Farimani < f.s.farimani@gmail.com> wrote:
Hello everyone,
Following this question <https://stackoverflow.com/q/53126305/4999991>, I'm convinced that numpy ndarrays are not MATLAB/mathematical multidimentional matrices and I should stop expecting them to be. However I still think it would have a lot of benefit to have a function like sympy's pprint to pretty print. something like pandas .head and .tail method plus .left .right .UpLeft .UpRight .DownLeft .DownRight methods. when nothing mentioned it would show 4 corners and put dots in the middle if the array is to big for the terminal.
Best, Foad _______________________________________________ NumPy-Discussion mailing list NumPy-Discussion@python.org https://mail.python.org/mailman/listinfo/numpy-discussion
_______________________________________________ NumPy-Discussion mailing list NumPy-Discussion@python.org https://mail.python.org/mailman/listinfo/numpy-discussion
It is not highking if I asked for it :)) for IPython/Jupyter using Markdown/LaTeX would be awesome or even better using HTML to add sliders just like Pandas... F. On Tue, Nov 6, 2018 at 6:51 AM Eric Wieser <wieser.eric+numpy@gmail.com> wrote:
Hijacking this thread while on the topic of pprint - we might want to look into a table-based `_html_repr_` or `_latex_repr_` for use in ipython - where we can print the full array and let scrollbars replace ellipses.
Eric
On Mon, 5 Nov 2018 at 21:11 Mark Harfouche <mark.harfouche@gmail.com> wrote:
Foad,
Visualizing data is definitely a complex field. I definitely feel your pain. Printing your data is but one way of visualizing it, and probably only useful for very small and constrained datasets. Have you looked into set_printoptions <https://docs.scipy.org/doc/numpy-1.15.1/reference/generated/numpy.set_printoptions.html> to see how numpy’s existing capabilities might help you with your visualization?
The code you showed seems quite good. I wouldn’t worry about performance when it comes to functions that will seldom be called in tight loops. As you’ll learn more about python and numpy, you’ll keep expanding it to include more use cases. For many of my projects, I create small submodules for visualization tailored to the specific needs of the particular project. I’ll try to incorporate your functions and see how I use them.
Your original post seems to have some confusion about C Style vs F Style ordering. I hope that has been resolved. There is also a lot of good documentation
https://docs.scipy.org/doc/numpy/user/numpy-for-matlab-users.html#numpy-for-... about transitioning from matlab.
Mark
On Mon, Nov 5, 2018 at 4:46 PM Foad Sojoodi Farimani < f.s.farimani@gmail.com> wrote:
Hello everyone,
Following this question <https://stackoverflow.com/q/53126305/4999991>, I'm convinced that numpy ndarrays are not MATLAB/mathematical multidimentional matrices and I should stop expecting them to be. However I still think it would have a lot of benefit to have a function like sympy's pprint to pretty print. something like pandas .head and .tail method plus .left .right .UpLeft .UpRight .DownLeft .DownRight methods. when nothing mentioned it would show 4 corners and put dots in the middle if the array is to big for the terminal.
Best, Foad _______________________________________________ NumPy-Discussion mailing list NumPy-Discussion@python.org https://mail.python.org/mailman/listinfo/numpy-discussion
_______________________________________________ NumPy-Discussion mailing list NumPy-Discussion@python.org https://mail.python.org/mailman/listinfo/numpy-discussion
_______________________________________________ NumPy-Discussion mailing list NumPy-Discussion@python.org https://mail.python.org/mailman/listinfo/numpy-discussion
Here's how that could look https://numpyintegration-ericwieser.notebooks.azure.com/j/notebooks/pprint.i... Feel free to play around and see if you can produce something more useful On Mon, 5 Nov 2018 at 23:28 Foad Sojoodi Farimani <f.s.farimani@gmail.com> wrote:
It is not highking if I asked for it :)) for IPython/Jupyter using Markdown/LaTeX would be awesome or even better using HTML to add sliders just like Pandas...
F.
On Tue, Nov 6, 2018 at 6:51 AM Eric Wieser <wieser.eric+numpy@gmail.com> wrote:
Hijacking this thread while on the topic of pprint - we might want to look into a table-based `_html_repr_` or `_latex_repr_` for use in ipython - where we can print the full array and let scrollbars replace ellipses.
Eric
On Mon, 5 Nov 2018 at 21:11 Mark Harfouche <mark.harfouche@gmail.com> wrote:
Foad,
Visualizing data is definitely a complex field. I definitely feel your pain. Printing your data is but one way of visualizing it, and probably only useful for very small and constrained datasets. Have you looked into set_printoptions <https://docs.scipy.org/doc/numpy-1.15.1/reference/generated/numpy.set_printoptions.html> to see how numpy’s existing capabilities might help you with your visualization?
The code you showed seems quite good. I wouldn’t worry about performance when it comes to functions that will seldom be called in tight loops. As you’ll learn more about python and numpy, you’ll keep expanding it to include more use cases. For many of my projects, I create small submodules for visualization tailored to the specific needs of the particular project. I’ll try to incorporate your functions and see how I use them.
Your original post seems to have some confusion about C Style vs F Style ordering. I hope that has been resolved. There is also a lot of good documentation
https://docs.scipy.org/doc/numpy/user/numpy-for-matlab-users.html#numpy-for-... about transitioning from matlab.
Mark
On Mon, Nov 5, 2018 at 4:46 PM Foad Sojoodi Farimani < f.s.farimani@gmail.com> wrote:
Hello everyone,
Following this question <https://stackoverflow.com/q/53126305/4999991>, I'm convinced that numpy ndarrays are not MATLAB/mathematical multidimentional matrices and I should stop expecting them to be. However I still think it would have a lot of benefit to have a function like sympy's pprint to pretty print. something like pandas .head and .tail method plus .left .right .UpLeft .UpRight .DownLeft .DownRight methods. when nothing mentioned it would show 4 corners and put dots in the middle if the array is to big for the terminal.
Best, Foad _______________________________________________ NumPy-Discussion mailing list NumPy-Discussion@python.org https://mail.python.org/mailman/listinfo/numpy-discussion
_______________________________________________ NumPy-Discussion mailing list NumPy-Discussion@python.org https://mail.python.org/mailman/listinfo/numpy-discussion
_______________________________________________ NumPy-Discussion mailing list NumPy-Discussion@python.org https://mail.python.org/mailman/listinfo/numpy-discussion
_______________________________________________ NumPy-Discussion mailing list NumPy-Discussion@python.org https://mail.python.org/mailman/listinfo/numpy-discussion
Wow, this is awesome. Some points though: - not everybody uses IPython/Jupyter having the functionality for conventional consols would also help. something like Sypy's init_printing/init_session which smartly chooses the right representation considering the terminal. - I don't think putting everything in boxes is helping. it is confusing. I would rather having horizontal and vertical square brackets represent each nested array - it would be awesome if in IPython/Jupyter hovering over an element a popup would show the index - one could read the width and height of the terminal and other options I mentioned in reply Mark to show L R U P or combination of these plus some numbers (similar to Pandas .head .tail) methods and then show the rest by unicod 3dot P.S. I had no idea our university Microsoft services also offers Azure Notebooks awesome :P F. On Tue, Nov 6, 2018 at 9:45 AM Eric Wieser <wieser.eric+numpy@gmail.com> wrote:
Here's how that could look
https://numpyintegration-ericwieser.notebooks.azure.com/j/notebooks/pprint.i...
Feel free to play around and see if you can produce something more useful
On Mon, 5 Nov 2018 at 23:28 Foad Sojoodi Farimani <f.s.farimani@gmail.com> wrote:
It is not highking if I asked for it :)) for IPython/Jupyter using Markdown/LaTeX would be awesome or even better using HTML to add sliders just like Pandas...
F.
On Tue, Nov 6, 2018 at 6:51 AM Eric Wieser <wieser.eric+numpy@gmail.com> wrote:
Hijacking this thread while on the topic of pprint - we might want to look into a table-based `_html_repr_` or `_latex_repr_` for use in ipython - where we can print the full array and let scrollbars replace ellipses.
Eric
On Mon, 5 Nov 2018 at 21:11 Mark Harfouche <mark.harfouche@gmail.com> wrote:
Foad,
Visualizing data is definitely a complex field. I definitely feel your pain. Printing your data is but one way of visualizing it, and probably only useful for very small and constrained datasets. Have you looked into set_printoptions <https://docs.scipy.org/doc/numpy-1.15.1/reference/generated/numpy.set_printoptions.html> to see how numpy’s existing capabilities might help you with your visualization?
The code you showed seems quite good. I wouldn’t worry about performance when it comes to functions that will seldom be called in tight loops. As you’ll learn more about python and numpy, you’ll keep expanding it to include more use cases. For many of my projects, I create small submodules for visualization tailored to the specific needs of the particular project. I’ll try to incorporate your functions and see how I use them.
Your original post seems to have some confusion about C Style vs F Style ordering. I hope that has been resolved. There is also a lot of good documentation
https://docs.scipy.org/doc/numpy/user/numpy-for-matlab-users.html#numpy-for-... about transitioning from matlab.
Mark
On Mon, Nov 5, 2018 at 4:46 PM Foad Sojoodi Farimani < f.s.farimani@gmail.com> wrote:
Hello everyone,
Following this question <https://stackoverflow.com/q/53126305/4999991>, I'm convinced that numpy ndarrays are not MATLAB/mathematical multidimentional matrices and I should stop expecting them to be. However I still think it would have a lot of benefit to have a function like sympy's pprint to pretty print. something like pandas .head and .tail method plus .left .right .UpLeft .UpRight .DownLeft .DownRight methods. when nothing mentioned it would show 4 corners and put dots in the middle if the array is to big for the terminal.
Best, Foad _______________________________________________ NumPy-Discussion mailing list NumPy-Discussion@python.org https://mail.python.org/mailman/listinfo/numpy-discussion
_______________________________________________ NumPy-Discussion mailing list NumPy-Discussion@python.org https://mail.python.org/mailman/listinfo/numpy-discussion
_______________________________________________ NumPy-Discussion mailing list NumPy-Discussion@python.org https://mail.python.org/mailman/listinfo/numpy-discussion
_______________________________________________ NumPy-Discussion mailing list NumPy-Discussion@python.org https://mail.python.org/mailman/listinfo/numpy-discussion
_______________________________________________ NumPy-Discussion mailing list NumPy-Discussion@python.org https://mail.python.org/mailman/listinfo/numpy-discussion
Foad, In response to: Thanks but I know it is very bad: - it does not work properly for floats - it only works for 1D and 2D - there can be some recursive function I believe. I think this is the awesome part about being able to write 10 lines of code that are specified to representing exactly 1 thing. Other than that, yeah, encouraging people to transition from matlab is challenging. Matlab is definitely good at doing matrix operations. Python3 somewhat helps in that regard. I'm super glad you are bringing usability issues up and working toward solving them. Maybe you can describe the interface for python you find practical to introduce to newcomers so as to motivate the discussion? Mark On Tue, Nov 6, 2018 at 3:57 AM Foad Sojoodi Farimani <f.s.farimani@gmail.com> wrote:
Wow, this is awesome. Some points though:
- not everybody uses IPython/Jupyter having the functionality for conventional consols would also help. something like Sypy's init_printing/init_session which smartly chooses the right representation considering the terminal. - I don't think putting everything in boxes is helping. it is confusing. I would rather having horizontal and vertical square brackets represent each nested array - it would be awesome if in IPython/Jupyter hovering over an element a popup would show the index - one could read the width and height of the terminal and other options I mentioned in reply Mark to show L R U P or combination of these plus some numbers (similar to Pandas .head .tail) methods and then show the rest by unicod 3dot
P.S. I had no idea our university Microsoft services also offers Azure Notebooks awesome :P
F.
On Tue, Nov 6, 2018 at 9:45 AM Eric Wieser <wieser.eric+numpy@gmail.com> wrote:
Here's how that could look
https://numpyintegration-ericwieser.notebooks.azure.com/j/notebooks/pprint.i...
Feel free to play around and see if you can produce something more useful
On Mon, 5 Nov 2018 at 23:28 Foad Sojoodi Farimani <f.s.farimani@gmail.com> wrote:
It is not highking if I asked for it :)) for IPython/Jupyter using Markdown/LaTeX would be awesome or even better using HTML to add sliders just like Pandas...
F.
On Tue, Nov 6, 2018 at 6:51 AM Eric Wieser <wieser.eric+numpy@gmail.com> wrote:
Hijacking this thread while on the topic of pprint - we might want to look into a table-based `_html_repr_` or `_latex_repr_` for use in ipython - where we can print the full array and let scrollbars replace ellipses.
Eric
On Mon, 5 Nov 2018 at 21:11 Mark Harfouche <mark.harfouche@gmail.com> wrote:
Foad,
Visualizing data is definitely a complex field. I definitely feel your pain. Printing your data is but one way of visualizing it, and probably only useful for very small and constrained datasets. Have you looked into set_printoptions <https://docs.scipy.org/doc/numpy-1.15.1/reference/generated/numpy.set_printoptions.html> to see how numpy’s existing capabilities might help you with your visualization?
The code you showed seems quite good. I wouldn’t worry about performance when it comes to functions that will seldom be called in tight loops. As you’ll learn more about python and numpy, you’ll keep expanding it to include more use cases. For many of my projects, I create small submodules for visualization tailored to the specific needs of the particular project. I’ll try to incorporate your functions and see how I use them.
Your original post seems to have some confusion about C Style vs F Style ordering. I hope that has been resolved. There is also a lot of good documentation
https://docs.scipy.org/doc/numpy/user/numpy-for-matlab-users.html#numpy-for-... about transitioning from matlab.
Mark
On Mon, Nov 5, 2018 at 4:46 PM Foad Sojoodi Farimani < f.s.farimani@gmail.com> wrote:
Hello everyone,
Following this question <https://stackoverflow.com/q/53126305/4999991>, I'm convinced that numpy ndarrays are not MATLAB/mathematical multidimentional matrices and I should stop expecting them to be. However I still think it would have a lot of benefit to have a function like sympy's pprint to pretty print. something like pandas .head and .tail method plus .left .right .UpLeft .UpRight .DownLeft .DownRight methods. when nothing mentioned it would show 4 corners and put dots in the middle if the array is to big for the terminal.
Best, Foad _______________________________________________ NumPy-Discussion mailing list NumPy-Discussion@python.org https://mail.python.org/mailman/listinfo/numpy-discussion
_______________________________________________ NumPy-Discussion mailing list NumPy-Discussion@python.org https://mail.python.org/mailman/listinfo/numpy-discussion
_______________________________________________ NumPy-Discussion mailing list NumPy-Discussion@python.org https://mail.python.org/mailman/listinfo/numpy-discussion
_______________________________________________ NumPy-Discussion mailing list NumPy-Discussion@python.org https://mail.python.org/mailman/listinfo/numpy-discussion
_______________________________________________ NumPy-Discussion mailing list NumPy-Discussion@python.org https://mail.python.org/mailman/listinfo/numpy-discussion
_______________________________________________ NumPy-Discussion mailing list NumPy-Discussion@python.org https://mail.python.org/mailman/listinfo/numpy-discussion
In between your lines: On Tue, Nov 6, 2018 at 11:07 AM Mark Harfouche <mark.harfouche@gmail.com> wrote:
Foad, In response to:
Thanks but I know it is very bad:
- it does not work properly for floats - it only works for 1D and 2D - there can be some recursive function I believe.
I think this is the awesome part about being able to write 10 lines of code that are specified to representing exactly 1 thing.
Other than that, yeah, encouraging people to transition from matlab is challenging. Matlab is definitely good at doing matrix operations. Python3 somewhat helps in that regard.
I'm super glad you are bringing usability issues up and working toward solving them.
Maybe you can describe the interface for python you find practical to introduce to newcomers so as to motivate the discussion?
I have been thinking about Spyder but it has a lot of issues with the standard python distribution and pip. Jupyterlab would be awesome except some Jupyter Notebook extensions are missing. For example variable inspector, RISE for slides, Hinterland, ... For the moment Jupyter Notebook is the most reliable/complete I could find. F.
Mark
On Tue, Nov 6, 2018 at 3:57 AM Foad Sojoodi Farimani < f.s.farimani@gmail.com> wrote:
Wow, this is awesome. Some points though:
- not everybody uses IPython/Jupyter having the functionality for conventional consols would also help. something like Sypy's init_printing/init_session which smartly chooses the right representation considering the terminal. - I don't think putting everything in boxes is helping. it is confusing. I would rather having horizontal and vertical square brackets represent each nested array - it would be awesome if in IPython/Jupyter hovering over an element a popup would show the index - one could read the width and height of the terminal and other options I mentioned in reply Mark to show L R U P or combination of these plus some numbers (similar to Pandas .head .tail) methods and then show the rest by unicod 3dot
P.S. I had no idea our university Microsoft services also offers Azure Notebooks awesome :P
F.
On Tue, Nov 6, 2018 at 9:45 AM Eric Wieser <wieser.eric+numpy@gmail.com> wrote:
Here's how that could look
https://numpyintegration-ericwieser.notebooks.azure.com/j/notebooks/pprint.i...
Feel free to play around and see if you can produce something more useful
On Mon, 5 Nov 2018 at 23:28 Foad Sojoodi Farimani < f.s.farimani@gmail.com> wrote:
It is not highking if I asked for it :)) for IPython/Jupyter using Markdown/LaTeX would be awesome or even better using HTML to add sliders just like Pandas...
F.
On Tue, Nov 6, 2018 at 6:51 AM Eric Wieser <wieser.eric+numpy@gmail.com> wrote:
Hijacking this thread while on the topic of pprint - we might want to look into a table-based `_html_repr_` or `_latex_repr_` for use in ipython - where we can print the full array and let scrollbars replace ellipses.
Eric
On Mon, 5 Nov 2018 at 21:11 Mark Harfouche <mark.harfouche@gmail.com> wrote:
Foad,
Visualizing data is definitely a complex field. I definitely feel your pain. Printing your data is but one way of visualizing it, and probably only useful for very small and constrained datasets. Have you looked into set_printoptions <https://docs.scipy.org/doc/numpy-1.15.1/reference/generated/numpy.set_printoptions.html> to see how numpy’s existing capabilities might help you with your visualization?
The code you showed seems quite good. I wouldn’t worry about performance when it comes to functions that will seldom be called in tight loops. As you’ll learn more about python and numpy, you’ll keep expanding it to include more use cases. For many of my projects, I create small submodules for visualization tailored to the specific needs of the particular project. I’ll try to incorporate your functions and see how I use them.
Your original post seems to have some confusion about C Style vs F Style ordering. I hope that has been resolved. There is also a lot of good documentation
https://docs.scipy.org/doc/numpy/user/numpy-for-matlab-users.html#numpy-for-... about transitioning from matlab.
Mark
On Mon, Nov 5, 2018 at 4:46 PM Foad Sojoodi Farimani < f.s.farimani@gmail.com> wrote:
> Hello everyone, > > Following this question > <https://stackoverflow.com/q/53126305/4999991>, I'm convinced that > numpy ndarrays are not MATLAB/mathematical multidimentional matrices and I > should stop expecting them to be. However I still think it would have a lot > of benefit to have a function like sympy's pprint to pretty print. > something like pandas .head and .tail method plus .left .right .UpLeft > .UpRight .DownLeft .DownRight methods. when nothing mentioned it would show > 4 corners and put dots in the middle if the array is to big for the > terminal. > > Best, > Foad > _______________________________________________ > NumPy-Discussion mailing list > NumPy-Discussion@python.org > https://mail.python.org/mailman/listinfo/numpy-discussion > _______________________________________________ NumPy-Discussion mailing list NumPy-Discussion@python.org https://mail.python.org/mailman/listinfo/numpy-discussion
_______________________________________________ NumPy-Discussion mailing list NumPy-Discussion@python.org https://mail.python.org/mailman/listinfo/numpy-discussion
_______________________________________________ NumPy-Discussion mailing list NumPy-Discussion@python.org https://mail.python.org/mailman/listinfo/numpy-discussion
_______________________________________________ NumPy-Discussion mailing list NumPy-Discussion@python.org https://mail.python.org/mailman/listinfo/numpy-discussion
_______________________________________________ NumPy-Discussion mailing list NumPy-Discussion@python.org https://mail.python.org/mailman/listinfo/numpy-discussion
_______________________________________________ NumPy-Discussion mailing list NumPy-Discussion@python.org https://mail.python.org/mailman/listinfo/numpy-discussion
To install spyder I wonder if Anaconda is a possibility. It also installs a lot of packages that your pupils/peers might be using but that you might not anticipate. On a semi-related note, a recent change to the repr broke a lot of downstream tests. Htlm and latex reprs are probably easier to experiment with on that sense. That said. That might just be a doctest issue and not a numpy issue. On Tue, Nov 6, 2018 at 5:18 AM Foad Sojoodi Farimani <f.s.farimani@gmail.com> wrote:
In between your lines:
On Tue, Nov 6, 2018 at 11:07 AM Mark Harfouche <mark.harfouche@gmail.com> wrote:
Foad, In response to:
Thanks but I know it is very bad:
- it does not work properly for floats - it only works for 1D and 2D - there can be some recursive function I believe.
I think this is the awesome part about being able to write 10 lines of code that are specified to representing exactly 1 thing.
Other than that, yeah, encouraging people to transition from matlab is challenging. Matlab is definitely good at doing matrix operations. Python3 somewhat helps in that regard.
I'm super glad you are bringing usability issues up and working toward solving them.
Maybe you can describe the interface for python you find practical to introduce to newcomers so as to motivate the discussion?
I have been thinking about Spyder but it has a lot of issues with the standard python distribution and pip. Jupyterlab would be awesome except some Jupyter Notebook extensions are missing. For example variable inspector, RISE for slides, Hinterland, ... For the moment Jupyter Notebook is the most reliable/complete I could find.
F.
Mark
On Tue, Nov 6, 2018 at 3:57 AM Foad Sojoodi Farimani < f.s.farimani@gmail.com> wrote:
Wow, this is awesome. Some points though:
- not everybody uses IPython/Jupyter having the functionality for conventional consols would also help. something like Sypy's init_printing/init_session which smartly chooses the right representation considering the terminal. - I don't think putting everything in boxes is helping. it is confusing. I would rather having horizontal and vertical square brackets represent each nested array - it would be awesome if in IPython/Jupyter hovering over an element a popup would show the index - one could read the width and height of the terminal and other options I mentioned in reply Mark to show L R U P or combination of these plus some numbers (similar to Pandas .head .tail) methods and then show the rest by unicod 3dot
P.S. I had no idea our university Microsoft services also offers Azure Notebooks awesome :P
F.
On Tue, Nov 6, 2018 at 9:45 AM Eric Wieser <wieser.eric+numpy@gmail.com> wrote:
Here's how that could look
https://numpyintegration-ericwieser.notebooks.azure.com/j/notebooks/pprint.i...
Feel free to play around and see if you can produce something more useful
On Mon, 5 Nov 2018 at 23:28 Foad Sojoodi Farimani < f.s.farimani@gmail.com> wrote:
It is not highking if I asked for it :)) for IPython/Jupyter using Markdown/LaTeX would be awesome or even better using HTML to add sliders just like Pandas...
F.
On Tue, Nov 6, 2018 at 6:51 AM Eric Wieser < wieser.eric+numpy@gmail.com> wrote:
Hijacking this thread while on the topic of pprint - we might want to look into a table-based `_html_repr_` or `_latex_repr_` for use in ipython - where we can print the full array and let scrollbars replace ellipses.
Eric
On Mon, 5 Nov 2018 at 21:11 Mark Harfouche <mark.harfouche@gmail.com> wrote:
> Foad, > > Visualizing data is definitely a complex field. I definitely feel > your pain. > Printing your data is but one way of visualizing it, and probably > only useful for very small and constrained datasets. > Have you looked into set_printoptions > <https://docs.scipy.org/doc/numpy-1.15.1/reference/generated/numpy.set_printoptions.html> > to see how numpy’s existing capabilities might help you with your > visualization? > > The code you showed seems quite good. I wouldn’t worry about > performance when it comes to functions that will seldom be called in tight > loops. > As you’ll learn more about python and numpy, you’ll keep expanding > it to include more use cases. > For many of my projects, I create small submodules for visualization > tailored to the specific needs of the particular project. > I’ll try to incorporate your functions and see how I use them. > > Your original post seems to have some confusion about C Style vs F > Style ordering. I hope that has been resolved. > There is also a lot of good documentation > > https://docs.scipy.org/doc/numpy/user/numpy-for-matlab-users.html#numpy-for-... > about transitioning from matlab. > > Mark > > On Mon, Nov 5, 2018 at 4:46 PM Foad Sojoodi Farimani < > f.s.farimani@gmail.com> wrote: > >> Hello everyone, >> >> Following this question >> <https://stackoverflow.com/q/53126305/4999991>, I'm convinced that >> numpy ndarrays are not MATLAB/mathematical multidimentional matrices and I >> should stop expecting them to be. However I still think it would have a lot >> of benefit to have a function like sympy's pprint to pretty print. >> something like pandas .head and .tail method plus .left .right .UpLeft >> .UpRight .DownLeft .DownRight methods. when nothing mentioned it would show >> 4 corners and put dots in the middle if the array is to big for the >> terminal. >> >> Best, >> Foad >> _______________________________________________ >> NumPy-Discussion mailing list >> NumPy-Discussion@python.org >> https://mail.python.org/mailman/listinfo/numpy-discussion >> > _______________________________________________ > NumPy-Discussion mailing list > NumPy-Discussion@python.org > https://mail.python.org/mailman/listinfo/numpy-discussion > _______________________________________________ NumPy-Discussion mailing list NumPy-Discussion@python.org https://mail.python.org/mailman/listinfo/numpy-discussion
_______________________________________________ NumPy-Discussion mailing list NumPy-Discussion@python.org https://mail.python.org/mailman/listinfo/numpy-discussion
_______________________________________________ NumPy-Discussion mailing list NumPy-Discussion@python.org https://mail.python.org/mailman/listinfo/numpy-discussion
_______________________________________________ NumPy-Discussion mailing list NumPy-Discussion@python.org https://mail.python.org/mailman/listinfo/numpy-discussion
_______________________________________________ NumPy-Discussion mailing list NumPy-Discussion@python.org https://mail.python.org/mailman/listinfo/numpy-discussion
_______________________________________________ NumPy-Discussion mailing list NumPy-Discussion@python.org https://mail.python.org/mailman/listinfo/numpy-discussion
Foad: having the functionality for conventional consols would also help I think the most important thing in a conventional console is to output the array in a format that allows you to reconstruct the object. That makes it way easier for people to reproduce each others problems without having their full dataset. If your goal is to visualize complex arrays, I think the console is a pretty limited tool, and numpy already does as much as is worthwhile there. I don’t think putting everything in boxes is helping. it is confusing. I would rather having horizontal and vertical square brackets represent each nested array See my update at the same link, which shows an alternative which draws those brackets as you envi it would be awesome if in IPython/Jupyter hovering over an element a popup would show the index It… already does? to show L R U P or combination of these plus some numbers I don’t know what you mean by this. Eric On Tue, 6 Nov 2018 at 00:56 Foad Sojoodi Farimani f.s.farimani@gmail.com <http://mailto:f.s.farimani@gmail.com> wrote: Wow, this is awesome.
Some points though:
- not everybody uses IPython/Jupyter having the functionality for conventional consols would also help. something like Sypy's init_printing/init_session which smartly chooses the right representation considering the terminal. - I don't think putting everything in boxes is helping. it is confusing. I would rather having horizontal and vertical square brackets represent each nested array - it would be awesome if in IPython/Jupyter hovering over an element a popup would show the index - one could read the width and height of the terminal and other options I mentioned in reply Mark to show L R U P or combination of these plus some numbers (similar to Pandas .head .tail) methods and then show the rest by unicod 3dot
P.S. I had no idea our university Microsoft services also offers Azure Notebooks awesome :P
F.
On Tue, Nov 6, 2018 at 9:45 AM Eric Wieser <wieser.eric+numpy@gmail.com> wrote:
Here's how that could look
https://numpyintegration-ericwieser.notebooks.azure.com/j/notebooks/pprint.i...
Feel free to play around and see if you can produce something more useful
On Mon, 5 Nov 2018 at 23:28 Foad Sojoodi Farimani <f.s.farimani@gmail.com> wrote:
It is not highking if I asked for it :)) for IPython/Jupyter using Markdown/LaTeX would be awesome or even better using HTML to add sliders just like Pandas...
F.
On Tue, Nov 6, 2018 at 6:51 AM Eric Wieser <wieser.eric+numpy@gmail.com> wrote:
Hijacking this thread while on the topic of pprint - we might want to look into a table-based `_html_repr_` or `_latex_repr_` for use in ipython - where we can print the full array and let scrollbars replace ellipses.
Eric
On Mon, 5 Nov 2018 at 21:11 Mark Harfouche <mark.harfouche@gmail.com> wrote:
Foad,
Visualizing data is definitely a complex field. I definitely feel your pain. Printing your data is but one way of visualizing it, and probably only useful for very small and constrained datasets. Have you looked into set_printoptions <https://docs.scipy.org/doc/numpy-1.15.1/reference/generated/numpy.set_printoptions.html> to see how numpy’s existing capabilities might help you with your visualization?
The code you showed seems quite good. I wouldn’t worry about performance when it comes to functions that will seldom be called in tight loops. As you’ll learn more about python and numpy, you’ll keep expanding it to include more use cases. For many of my projects, I create small submodules for visualization tailored to the specific needs of the particular project. I’ll try to incorporate your functions and see how I use them.
Your original post seems to have some confusion about C Style vs F Style ordering. I hope that has been resolved. There is also a lot of good documentation
https://docs.scipy.org/doc/numpy/user/numpy-for-matlab-users.html#numpy-for-... about transitioning from matlab.
Mark
On Mon, Nov 5, 2018 at 4:46 PM Foad Sojoodi Farimani < f.s.farimani@gmail.com> wrote:
Hello everyone,
Following this question <https://stackoverflow.com/q/53126305/4999991>, I'm convinced that numpy ndarrays are not MATLAB/mathematical multidimentional matrices and I should stop expecting them to be. However I still think it would have a lot of benefit to have a function like sympy's pprint to pretty print. something like pandas .head and .tail method plus .left .right .UpLeft .UpRight .DownLeft .DownRight methods. when nothing mentioned it would show 4 corners and put dots in the middle if the array is to big for the terminal.
Best, Foad _______________________________________________ NumPy-Discussion mailing list NumPy-Discussion@python.org https://mail.python.org/mailman/listinfo/numpy-discussion
_______________________________________________ NumPy-Discussion mailing list NumPy-Discussion@python.org https://mail.python.org/mailman/listinfo/numpy-discussion
_______________________________________________ NumPy-Discussion mailing list NumPy-Discussion@python.org https://mail.python.org/mailman/listinfo/numpy-discussion
_______________________________________________ NumPy-Discussion mailing list NumPy-Discussion@python.org https://mail.python.org/mailman/listinfo/numpy-discussion
_______________________________________________ NumPy-Discussion mailing list NumPy-Discussion@python.org https://mail.python.org/mailman/listinfo/numpy-discussion
_______________________________________________ NumPy-Discussion mailing list NumPy-Discussion@python.org https://mail.python.org/mailman/listinfo/numpy-discussion
Dear Eric, In between your lines: On Wed, Nov 7, 2018 at 7:23 AM Eric Wieser <wieser.eric+numpy@gmail.com> wrote:
Foad:
having the functionality for conventional consols would also help
I think the most important thing in a conventional console is to output the array in a format that allows you to reconstruct the object. That makes it way easier for people to reproduce each others problems without having their full dataset. If your goal is to visualize complex arrays, I think the console is a pretty limited tool, and numpy already does as much as is worthwhile there.
I agree with most of what you say: 1. the current representation of numpy array with print() is of course already there and it is not my goal to replace it. but rather add something like Sympy's pprint function, an alternative representation. 2. the reason I'm using console is first because there are people who use it and secondly because I have no idea how to do what you are doing :)) there is room for both I think I don’t think putting everything in boxes is helping. it is confusing. I
would rather having horizontal and vertical square brackets represent each nested array
See my update at the same link, which shows an alternative which draws those brackets as you envi
wow this is awesome: [image: 2018-11-07_09-07-37.gif] I wonder if you could make this the default view without the need of those other inputs or the lamda function? this is almost 80% of what I had in mind
it would be awesome if in IPython/Jupyter hovering over an element a popup would show the index
It… already does?
it doesn't on my browser :(
to show L R U P or combination of these plus some numbers
I don’t know what you mean by this.
imaging the Pandas .head() and .tail functions which accept positive integer inputs to show specific number of rows. now our print function could have two inputs one string which should be L for left, R for right, U for up and D for down. respectively UL, UR, DL and DR for corners. another input is a tuple of integers which in the case of U,D,L,R is only one integer showing the number of rows or columns. and in the case of UL, UR, DL, DR two integers showing the number of rows and columns in that specific corner to be shown. What could be added: 1. adding slide bars for big datasets 2. compressing the result according to the terminals dimensions (as Pandas does) 3. editing the variables like Spyders variable explorer 4. adding dimensions or rows/columns within a dimension or elements in rows/columns Again thanks a lot for your help. I appreciate your kind support. Best, Foad Eric
On Tue, 6 Nov 2018 at 00:56 Foad Sojoodi Farimani f.s.farimani@gmail.com <http://mailto:f.s.farimani@gmail.com> wrote:
Wow, this is awesome.
Some points though:
- not everybody uses IPython/Jupyter having the functionality for conventional consols would also help. something like Sypy's init_printing/init_session which smartly chooses the right representation considering the terminal. - I don't think putting everything in boxes is helping. it is confusing. I would rather having horizontal and vertical square brackets represent each nested array - it would be awesome if in IPython/Jupyter hovering over an element a popup would show the index - one could read the width and height of the terminal and other options I mentioned in reply Mark to show L R U P or combination of these plus some numbers (similar to Pandas .head .tail) methods and then show the rest by unicod 3dot
P.S. I had no idea our university Microsoft services also offers Azure Notebooks awesome :P
F.
On Tue, Nov 6, 2018 at 9:45 AM Eric Wieser <wieser.eric+numpy@gmail.com> wrote:
Here's how that could look
https://numpyintegration-ericwieser.notebooks.azure.com/j/notebooks/pprint.i...
Feel free to play around and see if you can produce something more useful
On Mon, 5 Nov 2018 at 23:28 Foad Sojoodi Farimani < f.s.farimani@gmail.com> wrote:
It is not highking if I asked for it :)) for IPython/Jupyter using Markdown/LaTeX would be awesome or even better using HTML to add sliders just like Pandas...
F.
On Tue, Nov 6, 2018 at 6:51 AM Eric Wieser <wieser.eric+numpy@gmail.com> wrote:
Hijacking this thread while on the topic of pprint - we might want to look into a table-based `_html_repr_` or `_latex_repr_` for use in ipython - where we can print the full array and let scrollbars replace ellipses.
Eric
On Mon, 5 Nov 2018 at 21:11 Mark Harfouche <mark.harfouche@gmail.com> wrote:
Foad,
Visualizing data is definitely a complex field. I definitely feel your pain. Printing your data is but one way of visualizing it, and probably only useful for very small and constrained datasets. Have you looked into set_printoptions <https://docs.scipy.org/doc/numpy-1.15.1/reference/generated/numpy.set_printoptions.html> to see how numpy’s existing capabilities might help you with your visualization?
The code you showed seems quite good. I wouldn’t worry about performance when it comes to functions that will seldom be called in tight loops. As you’ll learn more about python and numpy, you’ll keep expanding it to include more use cases. For many of my projects, I create small submodules for visualization tailored to the specific needs of the particular project. I’ll try to incorporate your functions and see how I use them.
Your original post seems to have some confusion about C Style vs F Style ordering. I hope that has been resolved. There is also a lot of good documentation
https://docs.scipy.org/doc/numpy/user/numpy-for-matlab-users.html#numpy-for-... about transitioning from matlab.
Mark
On Mon, Nov 5, 2018 at 4:46 PM Foad Sojoodi Farimani < f.s.farimani@gmail.com> wrote:
> Hello everyone, > > Following this question > <https://stackoverflow.com/q/53126305/4999991>, I'm convinced that > numpy ndarrays are not MATLAB/mathematical multidimentional matrices and I > should stop expecting them to be. However I still think it would have a lot > of benefit to have a function like sympy's pprint to pretty print. > something like pandas .head and .tail method plus .left .right .UpLeft > .UpRight .DownLeft .DownRight methods. when nothing mentioned it would show > 4 corners and put dots in the middle if the array is to big for the > terminal. > > Best, > Foad > _______________________________________________ > NumPy-Discussion mailing list > NumPy-Discussion@python.org > https://mail.python.org/mailman/listinfo/numpy-discussion > _______________________________________________ NumPy-Discussion mailing list NumPy-Discussion@python.org https://mail.python.org/mailman/listinfo/numpy-discussion
_______________________________________________ NumPy-Discussion mailing list NumPy-Discussion@python.org https://mail.python.org/mailman/listinfo/numpy-discussion
_______________________________________________ NumPy-Discussion mailing list NumPy-Discussion@python.org https://mail.python.org/mailman/listinfo/numpy-discussion
_______________________________________________ NumPy-Discussion mailing list NumPy-Discussion@python.org https://mail.python.org/mailman/listinfo/numpy-discussion
_______________________________________________ NumPy-Discussion mailing list NumPy-Discussion@python.org https://mail.python.org/mailman/listinfo/numpy-discussion
_______________________________________________ NumPy-Discussion mailing list NumPy-Discussion@python.org https://mail.python.org/mailman/listinfo/numpy-discussion
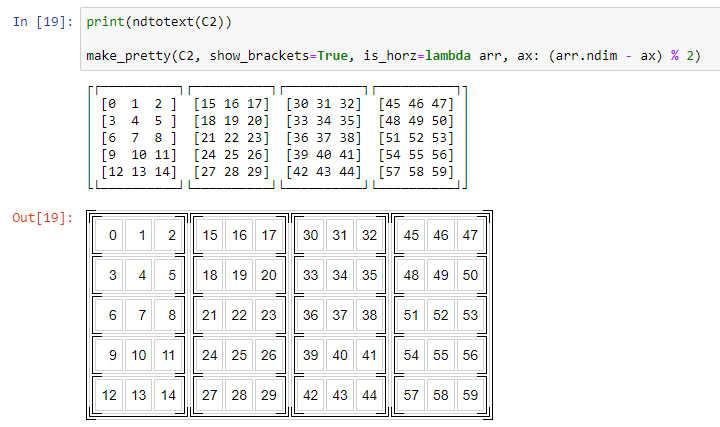
Der All, Here in this NoteBook <https://numpypprint-fsfarimani.notebooks.azure.com/j/notebooks/pprint.ipynb> I tried to compare my unicode implementation with Eric's HTML version plus links to the discussions on different forums if you like to follow For example: [image: chrome_2018-11-07_10-15-20.png] Best regards, Foad On Wed, Nov 7, 2018 at 9:24 AM Foad Sojoodi Farimani <f.s.farimani@gmail.com> wrote:
Dear Eric,
In between your lines:
On Wed, Nov 7, 2018 at 7:23 AM Eric Wieser <wieser.eric+numpy@gmail.com> wrote:
Foad:
having the functionality for conventional consols would also help
I think the most important thing in a conventional console is to output the array in a format that allows you to reconstruct the object. That makes it way easier for people to reproduce each others problems without having their full dataset. If your goal is to visualize complex arrays, I think the console is a pretty limited tool, and numpy already does as much as is worthwhile there.
I agree with most of what you say:
1. the current representation of numpy array with print() is of course already there and it is not my goal to replace it. but rather add something like Sympy's pprint function, an alternative representation. 2. the reason I'm using console is first because there are people who use it and secondly because I have no idea how to do what you are doing :)) there is room for both I think
I don’t think putting everything in boxes is helping. it is confusing. I
would rather having horizontal and vertical square brackets represent each nested array
See my update at the same link, which shows an alternative which draws those brackets as you envi
wow this is awesome:
[image: 2018-11-07_09-07-37.gif]
I wonder if you could make this the default view without the need of those other inputs or the lamda function? this is almost 80% of what I had in mind
it would be awesome if in IPython/Jupyter hovering over an element a popup would show the index
It… already does?
it doesn't on my browser :(
to show L R U P or combination of these plus some numbers
I don’t know what you mean by this.
imaging the Pandas .head() and .tail functions which accept positive integer inputs to show specific number of rows. now our print function could have two inputs one string which should be L for left, R for right, U for up and D for down. respectively UL, UR, DL and DR for corners. another input is a tuple of integers which in the case of U,D,L,R is only one integer showing the number of rows or columns. and in the case of UL, UR, DL, DR two integers showing the number of rows and columns in that specific corner to be shown.
What could be added:
1. adding slide bars for big datasets 2. compressing the result according to the terminals dimensions (as Pandas does) 3. editing the variables like Spyders variable explorer 4. adding dimensions or rows/columns within a dimension or elements in rows/columns
Again thanks a lot for your help. I appreciate your kind support.
Best, Foad
Eric
On Tue, 6 Nov 2018 at 00:56 Foad Sojoodi Farimani f.s.farimani@gmail.com <http://mailto:f.s.farimani@gmail.com> wrote:
Wow, this is awesome.
Some points though:
- not everybody uses IPython/Jupyter having the functionality for conventional consols would also help. something like Sypy's init_printing/init_session which smartly chooses the right representation considering the terminal. - I don't think putting everything in boxes is helping. it is confusing. I would rather having horizontal and vertical square brackets represent each nested array - it would be awesome if in IPython/Jupyter hovering over an element a popup would show the index - one could read the width and height of the terminal and other options I mentioned in reply Mark to show L R U P or combination of these plus some numbers (similar to Pandas .head .tail) methods and then show the rest by unicod 3dot
P.S. I had no idea our university Microsoft services also offers Azure Notebooks awesome :P
F.
On Tue, Nov 6, 2018 at 9:45 AM Eric Wieser <wieser.eric+numpy@gmail.com> wrote:
Here's how that could look
https://numpyintegration-ericwieser.notebooks.azure.com/j/notebooks/pprint.i...
Feel free to play around and see if you can produce something more useful
On Mon, 5 Nov 2018 at 23:28 Foad Sojoodi Farimani < f.s.farimani@gmail.com> wrote:
It is not highking if I asked for it :)) for IPython/Jupyter using Markdown/LaTeX would be awesome or even better using HTML to add sliders just like Pandas...
F.
On Tue, Nov 6, 2018 at 6:51 AM Eric Wieser < wieser.eric+numpy@gmail.com> wrote:
Hijacking this thread while on the topic of pprint - we might want to look into a table-based `_html_repr_` or `_latex_repr_` for use in ipython - where we can print the full array and let scrollbars replace ellipses.
Eric
On Mon, 5 Nov 2018 at 21:11 Mark Harfouche <mark.harfouche@gmail.com> wrote:
> Foad, > > Visualizing data is definitely a complex field. I definitely feel > your pain. > Printing your data is but one way of visualizing it, and probably > only useful for very small and constrained datasets. > Have you looked into set_printoptions > <https://docs.scipy.org/doc/numpy-1.15.1/reference/generated/numpy.set_printoptions.html> > to see how numpy’s existing capabilities might help you with your > visualization? > > The code you showed seems quite good. I wouldn’t worry about > performance when it comes to functions that will seldom be called in tight > loops. > As you’ll learn more about python and numpy, you’ll keep expanding > it to include more use cases. > For many of my projects, I create small submodules for visualization > tailored to the specific needs of the particular project. > I’ll try to incorporate your functions and see how I use them. > > Your original post seems to have some confusion about C Style vs F > Style ordering. I hope that has been resolved. > There is also a lot of good documentation > > https://docs.scipy.org/doc/numpy/user/numpy-for-matlab-users.html#numpy-for-... > about transitioning from matlab. > > Mark > > On Mon, Nov 5, 2018 at 4:46 PM Foad Sojoodi Farimani < > f.s.farimani@gmail.com> wrote: > >> Hello everyone, >> >> Following this question >> <https://stackoverflow.com/q/53126305/4999991>, I'm convinced that >> numpy ndarrays are not MATLAB/mathematical multidimentional matrices and I >> should stop expecting them to be. However I still think it would have a lot >> of benefit to have a function like sympy's pprint to pretty print. >> something like pandas .head and .tail method plus .left .right .UpLeft >> .UpRight .DownLeft .DownRight methods. when nothing mentioned it would show >> 4 corners and put dots in the middle if the array is to big for the >> terminal. >> >> Best, >> Foad >> _______________________________________________ >> NumPy-Discussion mailing list >> NumPy-Discussion@python.org >> https://mail.python.org/mailman/listinfo/numpy-discussion >> > _______________________________________________ > NumPy-Discussion mailing list > NumPy-Discussion@python.org > https://mail.python.org/mailman/listinfo/numpy-discussion > _______________________________________________ NumPy-Discussion mailing list NumPy-Discussion@python.org https://mail.python.org/mailman/listinfo/numpy-discussion
_______________________________________________ NumPy-Discussion mailing list NumPy-Discussion@python.org https://mail.python.org/mailman/listinfo/numpy-discussion
_______________________________________________ NumPy-Discussion mailing list NumPy-Discussion@python.org https://mail.python.org/mailman/listinfo/numpy-discussion
_______________________________________________ NumPy-Discussion mailing list NumPy-Discussion@python.org https://mail.python.org/mailman/listinfo/numpy-discussion
_______________________________________________ NumPy-Discussion mailing list NumPy-Discussion@python.org https://mail.python.org/mailman/listinfo/numpy-discussion
Dear Mark, Thanks for the reply. I will write in between your lines: On Tue, Nov 6, 2018 at 6:11 AM Mark Harfouche <mark.harfouche@gmail.com> wrote:
Foad,
Visualizing data is definitely a complex field. I definitely feel your pain.
I have actually been using numpy for a couple of years without noticing these issues. recently I have been trying to encourage my collogues to move from MATLAB to Python and also prepare some workshops for PhD network of my university.
Printing your data is but one way of visualizing it, and probably only useful for very small and constrained datasets.
well actually it can be very useful. Consider Pandas .head() and .tail() methods or Sympy's pretty printing functionalities. for bigger datasets the function can get the terminals width and height and then based on the input (U(n),D(n),L(n),R(n),UR(n,m),UL(n,m),DR(n,m),DL(n,m)) display what can be shown and put horizontal 3-dots \u2026 … or vertical/inclined ones. Or id it is Jupyter then one can use Markdown/LaTeX for pretty printing or even HTML to add sliders as suggested by Eric.
Have you looked into set_printoptions <https://docs.scipy.org/doc/numpy-1.15.1/reference/generated/numpy.set_printoptions.html> to see how numpy’s existing capabilities might help you with your visualization?
This is indeed very useful. specially the threshold option can help a lot with adjusting the width. but only for specific cases.
The code you showed seems quite good. I wouldn’t worry about performance when it comes to functions that will seldom be called in tight loops.
Thanks but I know it is very bad: - it does not work properly for floats - it only works for 1D and 2D - there can be some recursive function I believe. As you’ll learn more about python and numpy, you’ll keep expanding it to
include more use cases. For many of my projects, I create small submodules for visualization tailored to the specific needs of the particular project. I’ll try to incorporate your functions and see how I use them.
Thanks a lot. looking forwards to your feedback
Your original post seems to have some confusion about C Style vs F Style ordering. I hope that has been resolved.
I actually came to the conclusion that calling it C-Style or F-Style or maybe row-major column-major are bad practices. Numpy's ndarrays are not mathematical multidimensional arrays but Pythons nested, homogenous and uniform lists. it means for example 1, [1], [[1]] and [[[1]]] are all different, while in all other mathematical languages out there (including Sympy's matrices) they are the same.
There is also a lot of good documentation
https://docs.scipy.org/doc/numpy/user/numpy-for-matlab-users.html#numpy-for-... about transitioning from matlab.
I have seen this one and many others, which I'm trying to comprehend and then put in some slides made in Jupyter notebooks. Maybe when they are ready I will create a GitHub repo and upload them alongside the possible video recordings of the workshops. Foad
Mark
On Mon, Nov 5, 2018 at 4:46 PM Foad Sojoodi Farimani < f.s.farimani@gmail.com> wrote:
Hello everyone,
Following this question <https://stackoverflow.com/q/53126305/4999991>, I'm convinced that numpy ndarrays are not MATLAB/mathematical multidimentional matrices and I should stop expecting them to be. However I still think it would have a lot of benefit to have a function like sympy's pprint to pretty print. something like pandas .head and .tail method plus .left .right .UpLeft .UpRight .DownLeft .DownRight methods. when nothing mentioned it would show 4 corners and put dots in the middle if the array is to big for the terminal.
Best, Foad _______________________________________________ NumPy-Discussion mailing list NumPy-Discussion@python.org https://mail.python.org/mailman/listinfo/numpy-discussion
_______________________________________________ NumPy-Discussion mailing list NumPy-Discussion@python.org https://mail.python.org/mailman/listinfo/numpy-discussion

On Tue, Nov 6, 2018 at 8:26 AM Foad Sojoodi Farimani <f.s.farimani@gmail.com> wrote:
Dear Mark,
Thanks for the reply. I will write in between your lines:
On Tue, Nov 6, 2018 at 6:11 AM Mark Harfouche <mark.harfouche@gmail.com> wrote:
Foad,
Visualizing data is definitely a complex field. I definitely feel your pain.
I have actually been using numpy for a couple of years without noticing these issues. recently I have been trying to encourage my collogues to move from MATLAB to Python and also prepare some workshops for PhD network of my university.
Printing your data is but one way of visualizing it, and probably only useful for very small and constrained datasets.
well actually it can be very useful. Consider Pandas .head() and .tail() methods or Sympy's pretty printing functionalities. for bigger datasets the function can get the terminals width and height and then based on the input (U(n),D(n),L(n),R(n),UR(n,m),UL(n,m),DR(n,m),DL(n,m)) display what can be shown and put horizontal 3-dots \u2026 … or vertical/inclined ones. Or id it is Jupyter then one can use Markdown/LaTeX for pretty printing or even HTML to add sliders as suggested by Eric.
Have you looked into set_printoptions to see how numpy’s existing capabilities might help you with your visualization?
This is indeed very useful. specially the threshold option can help a lot with adjusting the width. but only for specific cases.
The code you showed seems quite good. I wouldn’t worry about performance when it comes to functions that will seldom be called in tight loops.
Thanks but I know it is very bad:
it does not work properly for floats it only works for 1D and 2D there can be some recursive function I believe.
As you’ll learn more about python and numpy, you’ll keep expanding it to include more use cases. For many of my projects, I create small submodules for visualization tailored to the specific needs of the particular project. I’ll try to incorporate your functions and see how I use them.
Thanks a lot. looking forwards to your feedback
Your original post seems to have some confusion about C Style vs F Style ordering. I hope that has been resolved.
I actually came to the conclusion that calling it C-Style or F-Style or maybe row-major column-major are bad practices. Numpy's ndarrays are not mathematical multidimensional arrays but Pythons nested, homogenous and uniform lists. it means for example 1, [1], [[1]] and [[[1]]] are all different, while in all other mathematical languages out there (including Sympy's matrices) they are the same.
I'm probably missing your point, because I don't understand your claim. Mathematically speaking, 1 and [1] and [[1] and [[[1]]] are different objects. One is a scalar, the second is an element of R^n with n=1 which is basically a scalar too from a math perspective, the third one is a 2-index object (an operator acting on R^1), the last one is a three-index object. These are all mathematically distinct. Furthermore, row-major and column-major order are a purely technical detail describing how the underlying data that is being represented by these multidimensional arrays is laid out in memory. So C/F-style order and the semantics of multidimensional arrays, at least as I see it, are independent notions. András
Dear András, Try those different option in MATLAB for example. or Octave/Scilab/Sympy-Matrix... they are all the same. The term "multidimensional arrays" is a little bit vague. one might think of multidimensional matrices ( I don't think there is such a thing in math) if coming from MATLAB. I also think the row-major column major terminology is confusing. there are no rows or columns for that matter. Numpy ndarrays are homogeneous, uniform nested lists. one can represent different layers of this list in different ways using rows or columns. regardless of all these different point of views having graphical and pretty printing representations would help a lot. that's my main goal at the moment. Best, Foad On Tue, Nov 6, 2018 at 11:43 AM Andras Deak <deak.andris@gmail.com> wrote:
On Tue, Nov 6, 2018 at 8:26 AM Foad Sojoodi Farimani <f.s.farimani@gmail.com> wrote:
Dear Mark,
Thanks for the reply. I will write in between your lines:
On Tue, Nov 6, 2018 at 6:11 AM Mark Harfouche <mark.harfouche@gmail.com>
Foad,
Visualizing data is definitely a complex field. I definitely feel your
wrote: pain.
I have actually been using numpy for a couple of years without noticing
Printing your data is but one way of visualizing it, and probably only
useful for very small and constrained datasets.
well actually it can be very useful. Consider Pandas .head() and .tail() methods or Sympy's pretty printing functionalities. for bigger datasets the function can get the terminals width and height and then based on the input (U(n),D(n),L(n),R(n),UR(n,m),UL(n,m),DR(n,m),DL(n,m)) display what can be shown and put horizontal 3-dots \u2026 … or vertical/inclined ones. Or id it is Jupyter then one can use Markdown/LaTeX for pretty printing or even HTML to add sliders as suggested by Eric.
Have you looked into set_printoptions to see how numpy’s existing
capabilities might help you with your visualization?
This is indeed very useful. specially the threshold option can help a lot with adjusting the width. but only for specific cases.
The code you showed seems quite good. I wouldn’t worry about
these issues. recently I have been trying to encourage my collogues to move from MATLAB to Python and also prepare some workshops for PhD network of my university. performance when it comes to functions that will seldom be called in tight loops.
Thanks but I know it is very bad:
it does not work properly for floats it only works for 1D and 2D there can be some recursive function I believe.
As you’ll learn more about python and numpy, you’ll keep expanding it
to include more use cases.
For many of my projects, I create small submodules for visualization tailored to the specific needs of the particular project. I’ll try to incorporate your functions and see how I use them.
Thanks a lot. looking forwards to your feedback
Your original post seems to have some confusion about C Style vs F
Style ordering. I hope that has been resolved.
I actually came to the conclusion that calling it C-Style or F-Style or maybe row-major column-major are bad practices. Numpy's ndarrays are not mathematical multidimensional arrays but Pythons nested, homogenous and uniform lists. it means for example 1, [1], [[1]] and [[[1]]] are all different, while in all other mathematical languages out there (including Sympy's matrices) they are the same.
I'm probably missing your point, because I don't understand your claim. Mathematically speaking, 1 and [1] and [[1] and [[[1]]] are different objects. One is a scalar, the second is an element of R^n with n=1 which is basically a scalar too from a math perspective, the third one is a 2-index object (an operator acting on R^1), the last one is a three-index object. These are all mathematically distinct. Furthermore, row-major and column-major order are a purely technical detail describing how the underlying data that is being represented by these multidimensional arrays is laid out in memory. So C/F-style order and the semantics of multidimensional arrays, at least as I see it, are independent notions.
András _______________________________________________ NumPy-Discussion mailing list NumPy-Discussion@python.org https://mail.python.org/mailman/listinfo/numpy-discussion

On Tue, Nov 6, 2018 at 3:56 AM Foad Sojoodi Farimani <f.s.farimani@gmail.com> wrote:
Dear András,
Try those different option in MATLAB for example. or Octave/Scilab/Sympy-Matrix... they are all the same. The term "multidimensional arrays" is a little bit vague. one might think of multidimensional matrices ( I don't think there is such a thing in math) if coming from MATLAB. I also think the row-major column major terminology is confusing. there are no rows or columns for that matter. Numpy ndarrays are homogeneous, uniform nested lists. one can represent different layers of this list in different ways using rows or columns.
I think the current popular terminology is `tensors` for `multidimensional arrays`. Note that matrices are a different type of object. <snip> Chuck

On Tue, Nov 6, 2018 at 6:43 AM Charles R Harris <charlesr.harris@gmail.com> wrote:
On Tue, Nov 6, 2018 at 3:56 AM Foad Sojoodi Farimani < f.s.farimani@gmail.com> wrote:
Dear András,
Try those different option in MATLAB for example. or Octave/Scilab/Sympy-Matrix... they are all the same.
Of course, these are all systems with a focus on matrices per se rather than general arrays. They take liberties with non-2-dim arrays that make sense if the focus is on treating 2-dim arrays as matrices. One of the motivating reason's for numpy's early development (as Numeric) was to get away from those assumptions and limitations and be a general array processing system. Part of the reason that we choose the terminology "multidimensional array" is to emphasize those differences.
The term "multidimensional arrays" is a little bit vague. one might think
of multidimensional matrices ( I don't think there is such a thing in math) if coming from MATLAB. I also think the row-major column major terminology is confusing. there are no rows or columns for that matter.
Granted, but it's long-established terminology, and not actually important for a user to know unless if someone is working in C with a flat representation of the allocated memory.
Numpy ndarrays are homogeneous, uniform nested lists. one can represent
different layers of this list in different ways using rows or columns.
You have to be careful here as well. "list" also has semantic baggage. Data structures are generally only called "lists" in a wide variety of programming languages if they have cheap appends and other such mutation operations. numpy arrays don't (as well as the things that we call "arrays" in FORTRAN and C/C++ that are distinct from what we would call "lists" in those languages). Please be assured that "multidimensional array" is terminology that we didn't make up. It does derive from a tradition of mathematical programming in FORTRAN and C and makes meaningful semantic distinctions within that tradition. There are other traditions, and we might well have settled on different terminology if we had derived from those. We do expect people to come from a variety of traditions and have a period of adjustment as they learn some new terminology. That's perfectly reasonable, which is good, because it is entirely unavoidable. There isn't a universal set of terminology that's going to work with everyone's experience out of the gate. I think the current popular terminology is `tensors` for `multidimensional
arrays`. Note that matrices are a different type of object.
Popular, but quite misleading, in the same way that not every 2-dim array is a matrix. As someone who works on tensor machine learning methods once complained to me. -- Robert Kern

On Tue, 06 Nov 2018 12:11:13 -0800, Robert Kern wrote:
Popular, but quite misleading, in the same way that not every 2-dim array is a matrix. As someone who works on tensor machine learning methods once complained to me.
Are you referring to vectors, structured arrays, or something else? Stéfan
On Tue, Nov 6, 2018 at 3:55 PM Stefan van der Walt <stefanv@berkeley.edu> wrote:
On Tue, 06 Nov 2018 12:11:13 -0800, Robert Kern wrote:
Popular, but quite misleading, in the same way that not every 2-dim array is a matrix. As someone who works on tensor machine learning methods once complained to me.
Are you referring to vectors, structured arrays, or something else?
I was responding to this statement by Chuck:
I think the current popular terminology is `tensors` for `multidimensional arrays`.
Mostly popularized by Tensorflow. But the "tensors" that flow through Tensorflow are mostly just multidimensional arrays and have no tensor-algebraic meaning. Similarly, a 2-dim array (say, a grayscale intensity image) doesn't necessarily have a matrix-algebraic interpretation, either. A 640x480 grayscale image is not a linear transformation from RR^640 to RR^480. It's just a collection of numbers that are convenient to organize as a 2D grid. This seems to be a pain point with some tensor methods ML researchers who have to explain their work to an audience that seems to think that Tensorflow must make their lives (and theses) easy. :-) -- Robert Kern
Hello Numpyers, I just added the pretty printing for 3D arrays too: https://stackoverflow.com/a/53164538/4999991 I would highly appreciate if you could check the implementation and let me know how do you think about it. Best, Foad On Mon, Nov 5, 2018 at 10:44 PM Foad Sojoodi Farimani < f.s.farimani@gmail.com> wrote:
Hello everyone,
Following this question <https://stackoverflow.com/q/53126305/4999991>, I'm convinced that numpy ndarrays are not MATLAB/mathematical multidimentional matrices and I should stop expecting them to be. However I still think it would have a lot of benefit to have a function like sympy's pprint to pretty print. something like pandas .head and .tail method plus .left .right .UpLeft .UpRight .DownLeft .DownRight methods. when nothing mentioned it would show 4 corners and put dots in the middle if the array is to big for the terminal.
Best, Foad
participants (7)
-
 Andras Deak
 -
 Charles R Harris
 -
 Eric Wieser
 -
 Foad Sojoodi Farimani
 -
 Mark Harfouche
 -
 Robert Kern
 -
 Stefan van der Walt