Getting scipy.interpolate.pchip_interpolate to return the first derivative of a pchip interpolation

I'm running SciPy ver. 1.9.3 under Python ver. 3.9.15 on a Mac Pro (2019) desktop running Mac OSX ver. 13.1 Ventura. The problem I'm having is getting scipy.interpolate.pchip_interpolate to return the first derivative of a pchip interpolation. The test program I'm using is given below (and attached to this note). import numpy as np import matplotlib.pyplot as plt from scipy.interpolate import pchip_interpolate x_observed = np.linspace(0.0, 360.0, 51) y_observed = np.sin(np.pi*x_observed/180) dydx_observed = np.cos(np.pi*x_observed/180) x = np.linspace(min(x_observed), max(x_observed), num=100) y = pchip_interpolate(x_observed, y_observed, x, der=0, axis=0) dydx = pchip_interpolate(x_observed, y_observed, x, der=1, axis=0) plt.plot(x_observed, y_observed, "bo" , label="observation funct") plt.plot(x_observed, dydx_observed, "rx" , label="observation deriv") plt.plot(x , y , "c-", label="pchip interpolation funct") plt.plot(x , dydx , "k-", label="pchip interpolation deriv") plt.legend() plt.savefig("pchip_example_01.png") plt.show() The program generates values of the sine function (y_observed) over the range of 0 to 360 degrees. (x_observed). In a similar fashion, the cosine function (first derivative of the sine function) is generated over the same range (dydx_observed). pchip_interpolate is used to perform the interpolation over a specified range for the function and its first derivative. A composite plot is generated showing the points for the function (the sine) and its first derivative (cosine). The interpolated points overlay the function (sine) as expected. However, the first derivative returned fails to overlay the cosine function. The plot is attached to this note. Any thoughts or suggestions? Sam Dupree

You should post at the scipy-user mailing list. See https://svn.scipy.org/scipylib/mailing-lists.html. On Sat, Jan 21, 2023 at 4:08 PM Samuel Dupree <sdupree@speakeasy.net> wrote:
I'm running SciPy ver. 1.9.3 under Python ver. 3.9.15 on a Mac Pro (2019) desktop running Mac OSX ver. 13.1 Ventura. The problem I'm having is getting scipy.interpolate.pchip_interpolate to return the first derivative of a pchip interpolation.
The test program I'm using is given below (and attached to this note).
import numpy as np import matplotlib.pyplot as plt from scipy.interpolate import pchip_interpolate
x_observed = np.linspace(0.0, 360.0, 51) y_observed = np.sin(np.pi*x_observed/180) dydx_observed = np.cos(np.pi*x_observed/180)
x = np.linspace(min(x_observed), max(x_observed), num=100) y = pchip_interpolate(x_observed, y_observed, x, der=0, axis=0) dydx = pchip_interpolate(x_observed, y_observed, x, der=1, axis=0)
plt.plot(x_observed, y_observed, "bo" , label="observation funct") plt.plot(x_observed, dydx_observed, "rx" , label="observation deriv") plt.plot(x , y , "c-", label="pchip interpolation funct") plt.plot(x , dydx , "k-", label="pchip interpolation deriv") plt.legend() plt.savefig("pchip_example_01.png") plt.show()
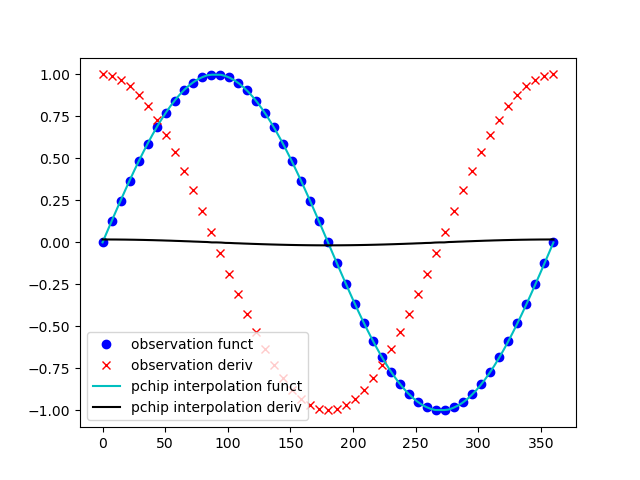
The program generates values of the sine function (y_observed) over the range of 0 to 360 degrees. (x_observed). In a similar fashion, the cosine function (first derivative of the sine function) is generated over the same range (dydx_observed). pchip_interpolate is used to perform the interpolation over a specified range for the function and its first derivative. A composite plot is generated showing the points for the function (the sine) and its first derivative (cosine). The interpolated points overlay the function (sine) as expected. However, the first derivative returned fails to overlay the cosine function. The plot is attached to this note.
Any thoughts or suggestions?
Sam Dupree _______________________________________________ NumPy-Discussion mailing list -- numpy-discussion@python.org To unsubscribe send an email to numpy-discussion-leave@python.org https://mail.python.org/mailman3/lists/numpy-discussion.python.org/ Member address: charlesr.harris@gmail.com
I believe I know what is going on, but I don't understand why. The line for the first derivative that failed to coincide with the points in the plot for the cosine is actually the interpolated first derivative scaled by the factor pi/180. When I multiply the interpolated values for the first derivative by 180/pi, the interpolated first derivative coincides with the points for the cosine as expected. What I don't understand is how the interpolator came up with the scale factor it did and applied it using pure numbers. Any thoughts? Sam Dupree. On 1/21/23 18:04, Samuel Dupree wrote:
I'm running SciPy ver. 1.9.3 under Python ver. 3.9.15 on a Mac Pro (2019) desktop running Mac OSX ver. 13.1 Ventura. The problem I'm having is getting scipy.interpolate.pchip_interpolate to return the first derivative of a pchip interpolation.
The test program I'm using is given below (and attached to this note).
import numpy as np import matplotlib.pyplot as plt from scipy.interpolate import pchip_interpolate
x_observed = np.linspace(0.0, 360.0, 51) y_observed = np.sin(np.pi*x_observed/180) dydx_observed = np.cos(np.pi*x_observed/180)
x = np.linspace(min(x_observed), max(x_observed), num=100) y = pchip_interpolate(x_observed, y_observed, x, der=0, axis=0) dydx = pchip_interpolate(x_observed, y_observed, x, der=1, axis=0)
plt.plot(x_observed, y_observed, "bo" , label="observation funct") plt.plot(x_observed, dydx_observed, "rx" , label="observation deriv") plt.plot(x , y , "c-", label="pchip interpolation funct") plt.plot(x , dydx , "k-", label="pchip interpolation deriv") plt.legend() plt.savefig("pchip_example_01.png") plt.show()
The program generates values of the sine function (y_observed) over the range of 0 to 360 degrees. (x_observed). In a similar fashion, the cosine function (first derivative of the sine function) is generated over the same range (dydx_observed). pchip_interpolate is used to perform the interpolation over a specified range for the function and its first derivative. A composite plot is generated showing the points for the function (the sine) and its first derivative (cosine). The interpolated points overlay the function (sine) as expected. However, the first derivative returned fails to overlay the cosine function. The plot is attached to this note.
Any thoughts or suggestions?
Sam Dupree
_______________________________________________ NumPy-Discussion mailing list --numpy-discussion@python.org To unsubscribe send an email tonumpy-discussion-leave@python.org https://mail.python.org/mailman3/lists/numpy-discussion.python.org/ Member address:sdupree@speakeasy.net

The PCHIP algorithm is written out in the SciPy API documentation: https://docs.scipy.org/doc/scipy/reference/generated/scipy.interpolate.Pchip... In general, there is no guarantee that if you tabulate and interpolate, the derivative matches the derivative of the underlying function. On Sun, Jan 22, 2023 at 12:51 PM Samuel Dupree <sdupree@speakeasy.net> wrote:
I believe I know what is going on, but I don't understand why.
The line for the first derivative that failed to coincide with the points in the plot for the cosine is actually the interpolated first derivative scaled by the factor pi/180. When I multiply the interpolated values for the first derivative by 180/pi, the interpolated first derivative coincides with the points for the cosine as expected.
What I don't understand is how the interpolator came up with the scale factor it did and applied it using pure numbers.
Any thoughts?
Sam Dupree.
On 1/21/23 18:04, Samuel Dupree wrote:
I'm running SciPy ver. 1.9.3 under Python ver. 3.9.15 on a Mac Pro (2019) desktop running Mac OSX ver. 13.1 Ventura. The problem I'm having is getting scipy.interpolate.pchip_interpolate to return the first derivative of a pchip interpolation.
The test program I'm using is given below (and attached to this note).
import numpy as np import matplotlib.pyplot as plt from scipy.interpolate import pchip_interpolate
x_observed = np.linspace(0.0, 360.0, 51) y_observed = np.sin(np.pi*x_observed/180) dydx_observed = np.cos(np.pi*x_observed/180)
x = np.linspace(min(x_observed), max(x_observed), num=100) y = pchip_interpolate(x_observed, y_observed, x, der=0, axis=0) dydx = pchip_interpolate(x_observed, y_observed, x, der=1, axis=0)
plt.plot(x_observed, y_observed, "bo" , label="observation funct") plt.plot(x_observed, dydx_observed, "rx" , label="observation deriv") plt.plot(x , y , "c-", label="pchip interpolation funct") plt.plot(x , dydx , "k-", label="pchip interpolation deriv") plt.legend() plt.savefig("pchip_example_01.png") plt.show()
The program generates values of the sine function (y_observed) over the range of 0 to 360 degrees. (x_observed). In a similar fashion, the cosine function (first derivative of the sine function) is generated over the same range (dydx_observed). pchip_interpolate is used to perform the interpolation over a specified range for the function and its first derivative. A composite plot is generated showing the points for the function (the sine) and its first derivative (cosine). The interpolated points overlay the function (sine) as expected. However, the first derivative returned fails to overlay the cosine function. The plot is attached to this note.
Any thoughts or suggestions?
Sam Dupree
_______________________________________________ NumPy-Discussion mailing list -- numpy-discussion@python.org To unsubscribe send an email to numpy-discussion-leave@python.org https://mail.python.org/mailman3/lists/numpy-discussion.python.org/ Member address: sdupree@speakeasy.net
_______________________________________________ NumPy-Discussion mailing list -- numpy-discussion@python.org To unsubscribe send an email to numpy-discussion-leave@python.org https://mail.python.org/mailman3/lists/numpy-discussion.python.org/ Member address: evgeny.burovskiy@gmail.com

On 22 Jan 2023, at 10:40 am, Samuel Dupree <sdupree@speakeasy.net<mailto:sdupree@speakeasy.net>> wrote: I believe I know what is going on, but I don't understand why. The line for the first derivative that failed to coincide with the points in the plot for the cosine is actually the interpolated first derivative scaled by the factor pi/180. When I multiply the interpolated values for the first derivative by 180/pi, the interpolated first derivative coincides with the points for the cosine as expected. What I don't understand is how the interpolator came up with the scale factor it did and applied it using pure numbers. Any thoughts? Sam Dupree. On 1/21/23 18:04, Samuel Dupree wrote: I'm running SciPy ver. 1.9.3 under Python ver. 3.9.15 on a Mac Pro (2019) desktop running Mac OSX ver. 13.1 Ventura. The problem I'm having is getting scipy.interpolate.pchip_interpolate to return the first derivative of a pchip interpolation. The test program I'm using is given below (and attached to this note). import numpy as np import matplotlib.pyplot as plt from scipy.interpolate import pchip_interpolate x_observed = np.linspace(0.0, 360.0, 51) y_observed = np.sin(np.pi*x_observed/180) dydx_observed = np.cos(np.pi*x_observed/180) Although you are running your calculations on pure numerical values, you have defined the sine as a function of x in degrees. So cosine really gives you the derivative wrt. (x * pi/180), dy / d(x_observed * np.pi/180) = np.cos(np.pi*x_observed/180). Besides, as noted in a previous post, the interpolated derivative may not reproduces exactly the derivative of the interpolation, but the 180/pi factor should come solely from the transformation to/from working in degrees. Cheers, Derek
participants (4)
-
 Charles R Harris
 -
 Evgeni Burovski
 -
 Homeier, Derek
 -
 Samuel Dupree