
Hi all, I've been experimenting with different ways to plot the transfer functions, and in particular in the context of the InteractiveCamera. What are people's thoughts about this behavior: http://i.imgur.com/CGZ7Z.png http://i.imgur.com/OCsVt.jpg http://i.imgur.com/VNEse.png btw, you can get this behavior by changing your script to call pf.h.interactive_camera, and then running in ipython with a working matplotlib backend. I'll let Nathan bring up his concerns rather than me try to convey them. Sam

I'd prefer it if the transfer function plot were split into two separate frames. Right now, it's easy to think that the black background color image contains opacity information since the frame is plotted with a y axis. I'd prefer it if only the white line was plotted with a y axis and the black background image was plotted in a separate frame like a color bar with no y axis. This would also let the user see the tick marks for the opacity plot much more easily. In general, I like plotting the transfer function like a color bar (sort of like Stella Offner's image on the yt homepage [http://yt-project.org/img/offner_etal.png]). Nathan Goldbaum Graduate Student Astronomy & Astrophysics, UCSC goldbaum@ucolick.org http://www.ucolick.org/~goldbaum On Jun 8, 2012, at 12:34 PM, Sam Skillman wrote:
Hi all,
I've been experimenting with different ways to plot the transfer functions, and in particular in the context of the InteractiveCamera.
What are people's thoughts about this behavior:
http://i.imgur.com/CGZ7Z.png http://i.imgur.com/OCsVt.jpg http://i.imgur.com/VNEse.png
btw, you can get this behavior by changing your script to call pf.h.interactive_camera, and then running in ipython with a working matplotlib backend.
I'll let Nathan bring up his concerns rather than me try to convey them.
Sam
!DSPAM:10175,4fd253db101042955315835! _______________________________________________ yt-dev mailing list yt-dev@lists.spacepope.org http://lists.spacepope.org/listinfo.cgi/yt-dev-spacepope.org
!DSPAM:10175,4fd253db101042955315835!

I acutally spend some time trying to plot the transfer function then sticking it to the side of the image, but gave up after I couldn't easily customize aspects of it. - What would be really cool is what you've done already, change the background color, probably something really easy but I didn't figure out how. - Another thing is to be able to use log scale on the Y axis, because with many added gaussian, you don't really see the ones on the small end. - Also if we can shrink the size then we can use it like a sort of colorbar (as Nathan pointed out) and glue it to the side or bottom of the volume rendering. - We can also annotate some of the volume rendering attributes on the side along with the transfer function/colorbar From G.S. On Fri, Jun 8, 2012 at 12:40 PM, Nathan Goldbaum <goldbaum@ucolick.org>wrote:
I'd prefer it if the transfer function plot were split into two separate frames. Right now, it's easy to think that the black background color image contains opacity information since the frame is plotted with a y axis. I'd prefer it if only the white line was plotted with a y axis and the black background image was plotted in a separate frame like a color bar with no y axis. This would also let the user see the tick marks for the opacity plot much more easily.
In general, I like plotting the transfer function like a color bar (sort of like Stella Offner's image on the yt homepage [ http://yt-project.org/img/offner_etal.png]).
Nathan Goldbaum Graduate Student Astronomy & Astrophysics, UCSC goldbaum@ucolick.org http://www.ucolick.org/~goldbaum
On Jun 8, 2012, at 12:34 PM, Sam Skillman wrote:
Hi all,
I've been experimenting with different ways to plot the transfer functions, and in particular in the context of the InteractiveCamera.
What are people's thoughts about this behavior:
http://i.imgur.com/CGZ7Z.png http://i.imgur.com/OCsVt.jpg http://i.imgur.com/VNEse.png
btw, you can get this behavior by changing your script to call pf.h.interactive_camera, and then running in ipython with a working matplotlib backend.
I'll let Nathan bring up his concerns rather than me try to convey them.
Sam
!DSPAM:10175,4fd253db101042955315835! _______________________________________________ yt-dev mailing list yt-dev@lists.spacepope.org http://lists.spacepope.org/listinfo.cgi/yt-dev-spacepope.org
!DSPAM:10175,4fd253db101042955315835!
_______________________________________________ yt-dev mailing list yt-dev@lists.spacepope.org http://lists.spacepope.org/listinfo.cgi/yt-dev-spacepope.org

Hey Geoffrey, Great suggestions -- thanks for chiming in! On Fri, Jun 8, 2012 at 4:09 PM, Geoffrey So <gsiisg@gmail.com> wrote:
I acutally spend some time trying to plot the transfer function then sticking it to the side of the image, but gave up after I couldn't easily customize aspects of it.
I'm sorry to hear that! Also, if you're particularly proud of a volume rendering, you should definitely spread it around along with a citation to the paper -- this goes for everybody else out there, too. I think we should continue to rotate the images in the little sliding thing on the website.
- What would be really cool is what you've done already, change the background color, probably something really easy but I didn't figure out how.
Ah, hmm, interesting idea. One problem with the idea of a background color is that we start with 0,0,0 for the rgb values, and we go from there. We might be able to get around this by defining some kind of intersection level, and alphas, but it's beyond what I'm capable of coming up with on a Friday afternoon. :)
- Another thing is to be able to use log scale on the Y axis, because with many added gaussian, you don't really see the ones on the small end.
Great point.
- Also if we can shrink the size then we can use it like a sort of colorbar (as Nathan pointed out) and glue it to the side or bottom of the volume rendering. - We can also annotate some of the volume rendering attributes on the side along with the transfer function/colorbar
I think this is a very valuable suggestion. In some talks I have given in the past I have used volume rendering to highlight densities of interest, and then put them alongside highlighted regions in a phase plot, to emphasize the correlation between the morphology evident in the VR with chemical changes. (I'm thinking the attached image, which comes from between slides 17-21 of this talk: http://www.as.utexas.edu/~fsgcon/abstracts_and_talks/m_turk_talk.html ) and I would love to be able to do similar things in a plot in a paper or an image on the web. Adding annotations to the colorbar would be great for that. Having the ability to not just control the VR explicitly, but also to add on colorbars, would help turn what is now primarily a visualization tool (although Cameron has some opinions on that) into something much more communicative. I'm glad this conversation got going! -Matt
From G.S. On Fri, Jun 8, 2012 at 12:40 PM, Nathan Goldbaum <goldbaum@ucolick.org> wrote:
I'd prefer it if the transfer function plot were split into two separate frames. Right now, it's easy to think that the black background color image contains opacity information since the frame is plotted with a y axis. I'd prefer it if only the white line was plotted with a y axis and the black background image was plotted in a separate frame like a color bar with no y axis. This would also let the user see the tick marks for the opacity plot much more easily.
In general, I like plotting the transfer function like a color bar (sort of like Stella Offner's image on the yt homepage [http://yt-project.org/img/offner_etal.png]).
Nathan Goldbaum Graduate Student Astronomy & Astrophysics, UCSC goldbaum@ucolick.org http://www.ucolick.org/~goldbaum
On Jun 8, 2012, at 12:34 PM, Sam Skillman wrote:
Hi all,
I've been experimenting with different ways to plot the transfer functions, and in particular in the context of the InteractiveCamera.
What are people's thoughts about this behavior:
http://i.imgur.com/CGZ7Z.png http://i.imgur.com/OCsVt.jpg http://i.imgur.com/VNEse.png
btw, you can get this behavior by changing your script to call pf.h.interactive_camera, and then running in ipython with a working matplotlib backend.
I'll let Nathan bring up his concerns rather than me try to convey them.
Sam
!DSPAM:10175,4fd253db101042955315835! _______________________________________________ yt-dev mailing list yt-dev@lists.spacepope.org http://lists.spacepope.org/listinfo.cgi/yt-dev-spacepope.org
!DSPAM:10175,4fd253db101042955315835!
_______________________________________________ yt-dev mailing list yt-dev@lists.spacepope.org http://lists.spacepope.org/listinfo.cgi/yt-dev-spacepope.org
_______________________________________________ yt-dev mailing list yt-dev@lists.spacepope.org http://lists.spacepope.org/listinfo.cgi/yt-dev-spacepope.org

On Jun 8, 2012, at 12:40 PM, Nathan Goldbaum wrote: I'd prefer it if the transfer function plot were split into two separate frames. Right now, it's easy to think that the black background color image contains opacity information since the frame is plotted with a y axis. I'd prefer it if only the white line was plotted with a y axis and the black background image was plotted in a separate frame like a color bar with no y axis. This would also let the user see the tick marks for the opacity plot much more easily. In general, I like plotting the transfer function like a color bar (sort of like Stella Offner's image on the yt homepage [http://yt-project.org/img/offner_etal.png]). That's what came to mind when I was reading this. For a while, we've been putting a combination color bar-transfer function graphic in our renderings with ANL (skip about 30 seconds into http://www.youtube.com/watch?v=5dOt0IaRY4U). I think it's very natural to overlay a transfer function plot onto a color bar, and it provides a lot of information in a simple fashion. --Rick Nathan Goldbaum Graduate Student Astronomy & Astrophysics, UCSC goldbaum@ucolick.org<mailto:goldbaum@ucolick.org> http://www.ucolick.org/~goldbaum On Jun 8, 2012, at 12:34 PM, Sam Skillman wrote: Hi all, I've been experimenting with different ways to plot the transfer functions, and in particular in the context of the InteractiveCamera. What are people's thoughts about this behavior: http://i.imgur.com/CGZ7Z.png http://i.imgur.com/OCsVt.jpg http://i.imgur.com/VNEse.png btw, you can get this behavior by changing your script to call pf.h.interactive_camera, and then running in ipython with a working matplotlib backend. I'll let Nathan bring up his concerns rather than me try to convey them. Sam !DSPAM:10175,4fd253db101042955315835! _______________________________________________ yt-dev mailing list yt-dev@lists.spacepope.org<mailto:yt-dev@lists.spacepope.org> http://lists.spacepope.org/listinfo.cgi/yt-dev-spacepope.org !DSPAM:10175,4fd253db101042955315835! _______________________________________________ yt-dev mailing list yt-dev@lists.spacepope.org<mailto:yt-dev@lists.spacepope.org> http://lists.spacepope.org/listinfo.cgi/yt-dev-spacepope.org
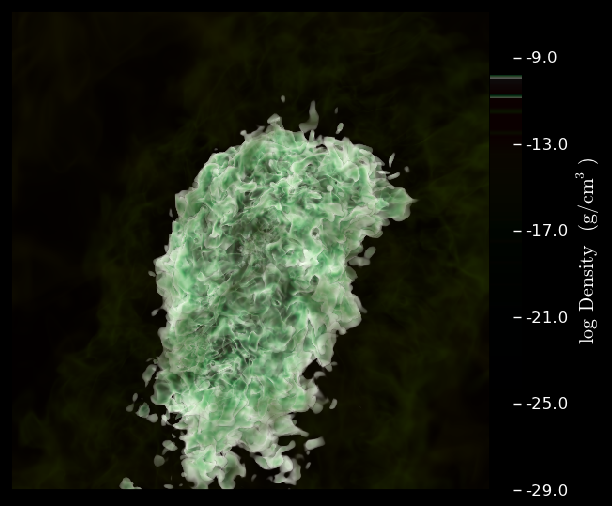
Okay, I've prototyped something that works like this: interactive_camera.snapshot() ...pops up interactive matplotlib window... interactive_camera.save('test.png') ...grabs all needed information and makes this... [image: Inline image 1] +/- 1? It just needs some cleanup, like reducing the extent of the colorbar so you don't get the black strip at the top and bottom of the image. Sam On Fri, Jun 8, 2012 at 2:12 PM, Richard P Wagner <rpwagner@sdsc.edu> wrote:
On Jun 8, 2012, at 12:40 PM, Nathan Goldbaum wrote:
I'd prefer it if the transfer function plot were split into two separate frames. Right now, it's easy to think that the black background color image contains opacity information since the frame is plotted with a y axis. I'd prefer it if only the white line was plotted with a y axis and the black background image was plotted in a separate frame like a color bar with no y axis. This would also let the user see the tick marks for the opacity plot much more easily.
In general, I like plotting the transfer function like a color bar (sort of like Stella Offner's image on the yt homepage [ http://yt-project.org/img/offner_etal.png]).
That's what came to mind when I was reading this. For a while, we've been putting a combination color bar-transfer function graphic in our renderings with ANL (skip about 30 seconds into http://www.youtube.com/watch?v=5dOt0IaRY4U). I think it's very natural to overlay a transfer function plot onto a color bar, and it provides a lot of information in a simple fashion.
--Rick
Nathan Goldbaum Graduate Student Astronomy & Astrophysics, UCSC goldbaum@ucolick.org http://www.ucolick.org/~goldbaum
On Jun 8, 2012, at 12:34 PM, Sam Skillman wrote:
Hi all,
I've been experimenting with different ways to plot the transfer functions, and in particular in the context of the InteractiveCamera.
What are people's thoughts about this behavior:
http://i.imgur.com/CGZ7Z.png http://i.imgur.com/OCsVt.jpg http://i.imgur.com/VNEse.png
btw, you can get this behavior by changing your script to call pf.h.interactive_camera, and then running in ipython with a working matplotlib backend.
I'll let Nathan bring up his concerns rather than me try to convey them.
Sam
!DSPAM:10175,4fd253db101042955315835! _______________________________________________ yt-dev mailing list yt-dev@lists.spacepope.org http://lists.spacepope.org/listinfo.cgi/yt-dev-spacepope.org
!DSPAM:10175,4fd253db101042955315835!
_______________________________________________ yt-dev mailing list yt-dev@lists.spacepope.org http://lists.spacepope.org/listinfo.cgi/yt-dev-spacepope.org
_______________________________________________ yt-dev mailing list yt-dev@lists.spacepope.org http://lists.spacepope.org/listinfo.cgi/yt-dev-spacepope.org
I don't think I can +1 this hard enough. It would also be great if I could get a similar plot without touching the interactive camera. Nathan Goldbaum Graduate Student Astronomy & Astrophysics, UCSC goldbaum@ucolick.org http://www.ucolick.org/~goldbaum On Jun 8, 2012, at 2:06 PM, Sam Skillman wrote:
Okay, I've prototyped something that works like this:
interactive_camera.snapshot() ...pops up interactive matplotlib window... interactive_camera.save('test.png') ...grabs all needed information and makes this...
<image.png>
+/- 1? It just needs some cleanup, like reducing the extent of the colorbar so you don't get the black strip at the top and bottom of the image.
Sam
On Fri, Jun 8, 2012 at 2:12 PM, Richard P Wagner <rpwagner@sdsc.edu> wrote:
On Jun 8, 2012, at 12:40 PM, Nathan Goldbaum wrote:
I'd prefer it if the transfer function plot were split into two separate frames. Right now, it's easy to think that the black background color image contains opacity information since the frame is plotted with a y axis. I'd prefer it if only the white line was plotted with a y axis and the black background image was plotted in a separate frame like a color bar with no y axis. This would also let the user see the tick marks for the opacity plot much more easily.
In general, I like plotting the transfer function like a color bar (sort of like Stella Offner's image on the yt homepage [http://yt-project.org/img/offner_etal.png]).
That's what came to mind when I was reading this. For a while, we've been putting a combination color bar-transfer function graphic in our renderings with ANL (skip about 30 seconds into http://www.youtube.com/watch?v=5dOt0IaRY4U). I think it's very natural to overlay a transfer function plot onto a color bar, and it provides a lot of information in a simple fashion.
--Rick
Nathan Goldbaum Graduate Student Astronomy & Astrophysics, UCSC goldbaum@ucolick.org http://www.ucolick.org/~goldbaum
On Jun 8, 2012, at 12:34 PM, Sam Skillman wrote:
Hi all,
I've been experimenting with different ways to plot the transfer functions, and in particular in the context of the InteractiveCamera.
What are people's thoughts about this behavior:
http://i.imgur.com/CGZ7Z.png http://i.imgur.com/OCsVt.jpg http://i.imgur.com/VNEse.png
btw, you can get this behavior by changing your script to call pf.h.interactive_camera, and then running in ipython with a working matplotlib backend.
I'll let Nathan bring up his concerns rather than me try to convey them.
Sam
_______________________________________________ yt-dev mailing list yt-dev@lists.spacepope.org http://lists.spacepope.org/listinfo.cgi/yt-dev-spacepope.org
!DSPAM:10175,4fd253db101042955315835!
_______________________________________________ yt-dev mailing list yt-dev@lists.spacepope.org http://lists.spacepope.org/listinfo.cgi/yt-dev-spacepope.org
_______________________________________________ yt-dev mailing list yt-dev@lists.spacepope.org http://lists.spacepope.org/listinfo.cgi/yt-dev-spacepope.org
!DSPAM:10175,4fd2698c154231999731220! _______________________________________________ yt-dev mailing list yt-dev@lists.spacepope.org http://lists.spacepope.org/listinfo.cgi/yt-dev-spacepope.org
!DSPAM:10175,4fd2698c154231999731220!

I don't think I can +1 this hard enough.
+1'nd with great prejudice. -- Stephen Skory s@skory.us http://stephenskory.com/ 510.621.3687 (google voice)
I like this behavior. It seems to me like this can/should also work with the camera independently, rihgt? Also, very nice job. Are you using pylab, or do you think this could be done with just our existing freetype-wrapping functionality? I'd prefer the latter ... :) On Fri, Jun 8, 2012 at 5:06 PM, Sam Skillman <samskillman@gmail.com> wrote:
Okay, I've prototyped something that works like this:
interactive_camera.snapshot() ...pops up interactive matplotlib window... interactive_camera.save('test.png') ...grabs all needed information and makes this...
[image: Inline image 1]
+/- 1? It just needs some cleanup, like reducing the extent of the colorbar so you don't get the black strip at the top and bottom of the image.
Sam
On Fri, Jun 8, 2012 at 2:12 PM, Richard P Wagner <rpwagner@sdsc.edu>wrote:
On Jun 8, 2012, at 12:40 PM, Nathan Goldbaum wrote:
I'd prefer it if the transfer function plot were split into two separate frames. Right now, it's easy to think that the black background color image contains opacity information since the frame is plotted with a y axis. I'd prefer it if only the white line was plotted with a y axis and the black background image was plotted in a separate frame like a color bar with no y axis. This would also let the user see the tick marks for the opacity plot much more easily.
In general, I like plotting the transfer function like a color bar (sort of like Stella Offner's image on the yt homepage [ http://yt-project.org/img/offner_etal.png]).
That's what came to mind when I was reading this. For a while, we've been putting a combination color bar-transfer function graphic in our renderings with ANL (skip about 30 seconds into http://www.youtube.com/watch?v=5dOt0IaRY4U). I think it's very natural to overlay a transfer function plot onto a color bar, and it provides a lot of information in a simple fashion.
--Rick
Nathan Goldbaum Graduate Student Astronomy & Astrophysics, UCSC goldbaum@ucolick.org http://www.ucolick.org/~goldbaum
On Jun 8, 2012, at 12:34 PM, Sam Skillman wrote:
Hi all,
I've been experimenting with different ways to plot the transfer functions, and in particular in the context of the InteractiveCamera.
What are people's thoughts about this behavior:
http://i.imgur.com/CGZ7Z.png http://i.imgur.com/OCsVt.jpg http://i.imgur.com/VNEse.png
btw, you can get this behavior by changing your script to call pf.h.interactive_camera, and then running in ipython with a working matplotlib backend.
I'll let Nathan bring up his concerns rather than me try to convey them.
Sam
!DSPAM:10175,4fd253db101042955315835! _______________________________________________ yt-dev mailing list yt-dev@lists.spacepope.org http://lists.spacepope.org/listinfo.cgi/yt-dev-spacepope.org
!DSPAM:10175,4fd253db101042955315835!
_______________________________________________ yt-dev mailing list yt-dev@lists.spacepope.org http://lists.spacepope.org/listinfo.cgi/yt-dev-spacepope.org
_______________________________________________ yt-dev mailing list yt-dev@lists.spacepope.org http://lists.spacepope.org/listinfo.cgi/yt-dev-spacepope.org
_______________________________________________ yt-dev mailing list yt-dev@lists.spacepope.org http://lists.spacepope.org/listinfo.cgi/yt-dev-spacepope.org

+1e6! I need to use something like this right now! :) Great work, Sam! On 6/8/12 5:06 PM, Sam Skillman wrote:
Okay, I've prototyped something that works like this:
interactive_camera.snapshot() ...pops up interactive matplotlib window... interactive_camera.save('test.png') ...grabs all needed information and makes this...
Inline image 1
+/- 1? It just needs some cleanup, like reducing the extent of the colorbar so you don't get the black strip at the top and bottom of the image.
Sam
On Fri, Jun 8, 2012 at 2:12 PM, Richard P Wagner <rpwagner@sdsc.edu <mailto:rpwagner@sdsc.edu>> wrote:
On Jun 8, 2012, at 12:40 PM, Nathan Goldbaum wrote:
I'd prefer it if the transfer function plot were split into two separate frames. Right now, it's easy to think that the black background color image contains opacity information since the frame is plotted with a y axis. I'd prefer it if only the white line was plotted with a y axis and the black background image was plotted in a separate frame like a color bar with no y axis. This would also let the user see the tick marks for the opacity plot much more easily.
In general, I like plotting the transfer function like a color bar (sort of like Stella Offner's image on the yt homepage [http://yt-project.org/img/offner_etal.png]).
That's what came to mind when I was reading this. For a while, we've been putting a combination color bar-transfer function graphic in our renderings with ANL (skip about 30 seconds into http://www.youtube.com/watch?v=5dOt0IaRY4U). I think it's very natural to overlay a transfer function plot onto a color bar, and it provides a lot of information in a simple fashion.
--Rick
Nathan Goldbaum Graduate Student Astronomy & Astrophysics, UCSC goldbaum@ucolick.org <mailto:goldbaum@ucolick.org> http://www.ucolick.org/~goldbaum <http://www.ucolick.org/%7Egoldbaum>
On Jun 8, 2012, at 12:34 PM, Sam Skillman wrote:
Hi all,
I've been experimenting with different ways to plot the transfer functions, and in particular in the context of the InteractiveCamera.
What are people's thoughts about this behavior:
http://i.imgur.com/CGZ7Z.png http://i.imgur.com/OCsVt.jpg http://i.imgur.com/VNEse.png
btw, you can get this behavior by changing your script to call pf.h.interactive_camera, and then running in ipython with a working matplotlib backend.
I'll let Nathan bring up his concerns rather than me try to convey them.
Sam
!DSPAM:10175,4fd253db101042955315835! _______________________________________________ yt-dev mailing list yt-dev@lists.spacepope.org <mailto:yt-dev@lists.spacepope.org> http://lists.spacepope.org/listinfo.cgi/yt-dev-spacepope.org
!DSPAM:10175,4fd253db101042955315835!
_______________________________________________ yt-dev mailing list yt-dev@lists.spacepope.org <mailto:yt-dev@lists.spacepope.org> http://lists.spacepope.org/listinfo.cgi/yt-dev-spacepope.org
_______________________________________________ yt-dev mailing list yt-dev@lists.spacepope.org <mailto:yt-dev@lists.spacepope.org> http://lists.spacepope.org/listinfo.cgi/yt-dev-spacepope.org
_______________________________________________ yt-dev mailing list yt-dev@lists.spacepope.org http://lists.spacepope.org/listinfo.cgi/yt-dev-spacepope.org

Beautiful, +1! chris On Fri, Jun 8, 2012 at 2:22 PM, Cameron Hummels <chummels@astro.columbia.edu> wrote:
+1e6! I need to use something like this right now! :) Great work, Sam!
On 6/8/12 5:06 PM, Sam Skillman wrote:
Okay, I've prototyped something that works like this:
interactive_camera.snapshot() ...pops up interactive matplotlib window... interactive_camera.save('test.png') ...grabs all needed information and makes this...
Inline image 1
+/- 1? It just needs some cleanup, like reducing the extent of the colorbar so you don't get the black strip at the top and bottom of the image.
Sam
On Fri, Jun 8, 2012 at 2:12 PM, Richard P Wagner <rpwagner@sdsc.edu <mailto:rpwagner@sdsc.edu>> wrote:
On Jun 8, 2012, at 12:40 PM, Nathan Goldbaum wrote:
I'd prefer it if the transfer function plot were split into two separate frames. Right now, it's easy to think that the black background color image contains opacity information since the frame is plotted with a y axis. I'd prefer it if only the white line was plotted with a y axis and the black background image was plotted in a separate frame like a color bar with no y axis. This would also let the user see the tick marks for the opacity plot much more easily.
In general, I like plotting the transfer function like a color bar (sort of like Stella Offner's image on the yt homepage [http://yt-project.org/img/offner_etal.png]).
That's what came to mind when I was reading this. For a while, we've been putting a combination color bar-transfer function graphic in our renderings with ANL (skip about 30 seconds into http://www.youtube.com/watch?v=5dOt0IaRY4U). I think it's very natural to overlay a transfer function plot onto a color bar, and it provides a lot of information in a simple fashion.
--Rick
Nathan Goldbaum Graduate Student Astronomy & Astrophysics, UCSC goldbaum@ucolick.org <mailto:goldbaum@ucolick.org> http://www.ucolick.org/~goldbaum <http://www.ucolick.org/%7Egoldbaum>
On Jun 8, 2012, at 12:34 PM, Sam Skillman wrote:
Hi all,
I've been experimenting with different ways to plot the transfer functions, and in particular in the context of the InteractiveCamera.
What are people's thoughts about this behavior:
http://i.imgur.com/CGZ7Z.png http://i.imgur.com/OCsVt.jpg http://i.imgur.com/VNEse.png
btw, you can get this behavior by changing your script to call pf.h.interactive_camera, and then running in ipython with a working matplotlib backend.
I'll let Nathan bring up his concerns rather than me try to convey them.
Sam
!DSPAM:10175,4fd253db101042955315835! _______________________________________________ yt-dev mailing list yt-dev@lists.spacepope.org <mailto:yt-dev@lists.spacepope.org> http://lists.spacepope.org/listinfo.cgi/yt-dev-spacepope.org
!DSPAM:10175,4fd253db101042955315835!
_______________________________________________ yt-dev mailing list yt-dev@lists.spacepope.org <mailto:yt-dev@lists.spacepope.org> http://lists.spacepope.org/listinfo.cgi/yt-dev-spacepope.org
_______________________________________________ yt-dev mailing list yt-dev@lists.spacepope.org <mailto:yt-dev@lists.spacepope.org>
http://lists.spacepope.org/listinfo.cgi/yt-dev-spacepope.org
_______________________________________________ yt-dev mailing list yt-dev@lists.spacepope.org http://lists.spacepope.org/listinfo.cgi/yt-dev-spacepope.org
_______________________________________________ yt-dev mailing list yt-dev@lists.spacepope.org http://lists.spacepope.org/listinfo.cgi/yt-dev-spacepope.org
Matt: I'm using pylab. One thing I'm going to change is modify it so that it gets the resolution of the image, then sets the pylab figure size based off that. I'd also rather have this go through freetype, but the development time for that for me is >> (time left this afternoon). I'd be +1 to porting to freetype. This is _very_ loosely coupled to the interactive camera. I'm going to (right now) move it over to the general camera class, and make it have the API: cam.save_annotated(fn, im=None, enhance=True) This will take the filename, the previously produced image array or try to get the cam.image array (which exists for some variants of the camera), and then apply the standard deviation clipping that is presence in the enhance.py on the hub. I'm going to strongly encourage the enhance=True. I've been making movies that use the same normalization and have been happy with all of them. While I'm at it, I'll add a cam.save(fn, im, enhance=True) that skips the annotation. +/- 1 on those additions? Requests? All others: Thanks for the enthusiastic response! Sam On Fri, Jun 8, 2012 at 3:28 PM, Christopher Moody <cemoody@ucsc.edu> wrote:
Beautiful, +1!
chris
On Fri, Jun 8, 2012 at 2:22 PM, Cameron Hummels <chummels@astro.columbia.edu> wrote:
+1e6! I need to use something like this right now! :) Great work, Sam!
On 6/8/12 5:06 PM, Sam Skillman wrote:
Okay, I've prototyped something that works like this:
interactive_camera.snapshot() ...pops up interactive matplotlib window... interactive_camera.save('test.png') ...grabs all needed information and makes this...
Inline image 1
+/- 1? It just needs some cleanup, like reducing the extent of the colorbar so you don't get the black strip at the top and bottom of the image.
Sam
On Fri, Jun 8, 2012 at 2:12 PM, Richard P Wagner <rpwagner@sdsc.edu <mailto:rpwagner@sdsc.edu>> wrote:
On Jun 8, 2012, at 12:40 PM, Nathan Goldbaum wrote:
I'd prefer it if the transfer function plot were split into two separate frames. Right now, it's easy to think that the black background color image contains opacity information since the frame is plotted with a y axis. I'd prefer it if only the white line was plotted with a y axis and the black background image was plotted in a separate frame like a color bar with no y axis. This would also let the user see the tick marks for the opacity plot much more easily.
In general, I like plotting the transfer function like a color bar (sort of like Stella Offner's image on the yt homepage [http://yt-project.org/img/offner_etal.png]).
That's what came to mind when I was reading this. For a while, we've been putting a combination color bar-transfer function graphic in our renderings with ANL (skip about 30 seconds into http://www.youtube.com/watch?v=5dOt0IaRY4U). I think it's very natural to overlay a transfer function plot onto a color bar, and it provides a lot of information in a simple fashion.
--Rick
Nathan Goldbaum Graduate Student Astronomy & Astrophysics, UCSC goldbaum@ucolick.org <mailto:goldbaum@ucolick.org> http://www.ucolick.org/~goldbaum <
http://www.ucolick.org/%7Egoldbaum>
On Jun 8, 2012, at 12:34 PM, Sam Skillman wrote:
Hi all,
I've been experimenting with different ways to plot the transfer functions, and in particular in the context of the InteractiveCamera.
What are people's thoughts about this behavior:
http://i.imgur.com/CGZ7Z.png http://i.imgur.com/OCsVt.jpg http://i.imgur.com/VNEse.png
btw, you can get this behavior by changing your script to call pf.h.interactive_camera, and then running in ipython with a working matplotlib backend.
I'll let Nathan bring up his concerns rather than me try to convey them.
Sam
!DSPAM:10175,4fd253db101042955315835! _______________________________________________ yt-dev mailing list yt-dev@lists.spacepope.org <mailto:yt-dev@lists.spacepope.org> http://lists.spacepope.org/listinfo.cgi/yt-dev-spacepope.org
!DSPAM:10175,4fd253db101042955315835!
_______________________________________________ yt-dev mailing list yt-dev@lists.spacepope.org <mailto:yt-dev@lists.spacepope.org> http://lists.spacepope.org/listinfo.cgi/yt-dev-spacepope.org
_______________________________________________ yt-dev mailing list yt-dev@lists.spacepope.org <mailto:yt-dev@lists.spacepope.org>
http://lists.spacepope.org/listinfo.cgi/yt-dev-spacepope.org
_______________________________________________ yt-dev mailing list yt-dev@lists.spacepope.org http://lists.spacepope.org/listinfo.cgi/yt-dev-spacepope.org
_______________________________________________ yt-dev mailing list yt-dev@lists.spacepope.org http://lists.spacepope.org/listinfo.cgi/yt-dev-spacepope.org
yt-dev mailing list yt-dev@lists.spacepope.org http://lists.spacepope.org/listinfo.cgi/yt-dev-spacepope.org
+1 on all of those suggestions. Thanks for this addition, Sam! If you push this, I may add a few parameters to annotate which allow for overplotting a size scale bar and a redshift/time annotation in a corner for use in movies. Cameron On 6/8/12 5:30 PM, Sam Skillman wrote:
Matt:
I'm using pylab. One thing I'm going to change is modify it so that it gets the resolution of the image, then sets the pylab figure size based off that. I'd also rather have this go through freetype, but the development time for that for me is >> (time left this afternoon). I'd be +1 to porting to freetype.
This is _very_ loosely coupled to the interactive camera. I'm going to (right now) move it over to the general camera class, and make it have the API:
cam.save_annotated(fn, im=None, enhance=True)
This will take the filename, the previously produced image array or try to get the cam.image array (which exists for some variants of the camera), and then apply the standard deviation clipping that is presence in the enhance.py on the hub. I'm going to strongly encourage the enhance=True. I've been making movies that use the same normalization and have been happy with all of them.
While I'm at it, I'll add a cam.save(fn, im, enhance=True) that skips the annotation.
+/- 1 on those additions? Requests?
All others: Thanks for the enthusiastic response!
Sam
On Fri, Jun 8, 2012 at 3:28 PM, Christopher Moody <cemoody@ucsc.edu <mailto:cemoody@ucsc.edu>> wrote:
Beautiful, +1!
chris
On Fri, Jun 8, 2012 at 2:22 PM, Cameron Hummels <chummels@astro.columbia.edu <mailto:chummels@astro.columbia.edu>> wrote: > +1e6! I need to use something like this right now! :) Great work, Sam! > > > On 6/8/12 5:06 PM, Sam Skillman wrote: >> >> Okay, I've prototyped something that works like this: >> >> interactive_camera.snapshot() >> ...pops up interactive matplotlib window... >> interactive_camera.save('test.png') >> ...grabs all needed information and makes this... >> >> Inline image 1 >> >> +/- 1? It just needs some cleanup, like reducing the extent of the >> colorbar so you don't get the black strip at the top and bottom of the >> image. >> >> Sam >> >> On Fri, Jun 8, 2012 at 2:12 PM, Richard P Wagner <rpwagner@sdsc.edu <mailto:rpwagner@sdsc.edu> >> <mailto:rpwagner@sdsc.edu <mailto:rpwagner@sdsc.edu>>> wrote: >> >> >> On Jun 8, 2012, at 12:40 PM, Nathan Goldbaum wrote: >> >>> I'd prefer it if the transfer function plot were split into two >>> separate frames. Right now, it's easy to think that the black >>> background color image contains opacity information since the >>> frame is plotted with a y axis. I'd prefer it if only the white >>> line was plotted with a y axis and the black background image was >>> plotted in a separate frame like a color bar with no y axis. >>> This would also let the user see the tick marks for the opacity >>> plot much more easily. >>> >>> In general, I like plotting the transfer function like a color >>> bar (sort of like Stella Offner's image on the yt homepage >>> [http://yt-project.org/img/offner_etal.png]). >> >> >> That's what came to mind when I was reading this. For a while, >> we've been putting a combination color bar-transfer function >> graphic in our renderings with ANL (skip about 30 seconds into >> http://www.youtube.com/watch?v=5dOt0IaRY4U). I think it's very >> natural to overlay a transfer function plot onto a color bar, and >> it provides a lot of information in a simple fashion. >> >> --Rick >> >>> >>> Nathan Goldbaum >>> Graduate Student >>> Astronomy & Astrophysics, UCSC >>> goldbaum@ucolick.org <mailto:goldbaum@ucolick.org> <mailto:goldbaum@ucolick.org <mailto:goldbaum@ucolick.org>> >>> http://www.ucolick.org/~goldbaum <http://www.ucolick.org/%7Egoldbaum> <http://www.ucolick.org/%7Egoldbaum> >>> >>> >>> On Jun 8, 2012, at 12:34 PM, Sam Skillman wrote: >>> >>>> Hi all, >>>> >>>> I've been experimenting with different ways to plot the transfer >>>> functions, and in particular in the context of the >>>> InteractiveCamera. >>>> >>>> What are people's thoughts about this behavior: >>>> >>>> http://i.imgur.com/CGZ7Z.png >>>> http://i.imgur.com/OCsVt.jpg >>>> http://i.imgur.com/VNEse.png >>>> >>>> btw, you can get this behavior by changing your script to call >>>> pf.h.interactive_camera, and then running in ipython with a >>>> working matplotlib backend. >>>> >>>> I'll let Nathan bring up his concerns rather than me try to >>>> convey them. >>>> >>>> Sam >>>> >>>> >>>> >>>> !DSPAM:10175,4fd253db101042955315835! >>>> _______________________________________________ >>>> yt-dev mailing list >>>> yt-dev@lists.spacepope.org <mailto:yt-dev@lists.spacepope.org> <mailto:yt-dev@lists.spacepope.org <mailto:yt-dev@lists.spacepope.org>> >>>> http://lists.spacepope.org/listinfo.cgi/yt-dev-spacepope.org >>>> >>>> >>>> !DSPAM:10175,4fd253db101042955315835! >>> >>> >>> _______________________________________________ >>> yt-dev mailing list >>> yt-dev@lists.spacepope.org <mailto:yt-dev@lists.spacepope.org> <mailto:yt-dev@lists.spacepope.org <mailto:yt-dev@lists.spacepope.org>> >>> http://lists.spacepope.org/listinfo.cgi/yt-dev-spacepope.org >> >> >> >> _______________________________________________ >> yt-dev mailing list >> yt-dev@lists.spacepope.org <mailto:yt-dev@lists.spacepope.org> <mailto:yt-dev@lists.spacepope.org <mailto:yt-dev@lists.spacepope.org>> >> >> http://lists.spacepope.org/listinfo.cgi/yt-dev-spacepope.org >> >> >> >> >> _______________________________________________ >> yt-dev mailing list >> yt-dev@lists.spacepope.org <mailto:yt-dev@lists.spacepope.org> >> http://lists.spacepope.org/listinfo.cgi/yt-dev-spacepope.org > > _______________________________________________ > yt-dev mailing list > yt-dev@lists.spacepope.org <mailto:yt-dev@lists.spacepope.org> > http://lists.spacepope.org/listinfo.cgi/yt-dev-spacepope.org _______________________________________________ yt-dev mailing list yt-dev@lists.spacepope.org <mailto:yt-dev@lists.spacepope.org> http://lists.spacepope.org/listinfo.cgi/yt-dev-spacepope.org
_______________________________________________ yt-dev mailing list yt-dev@lists.spacepope.org http://lists.spacepope.org/listinfo.cgi/yt-dev-spacepope.org
Hi Sam, On Fri, Jun 8, 2012 at 5:30 PM, Sam Skillman <samskillman@gmail.com> wrote:
Matt:
I'm using pylab. One thing I'm going to change is modify it so that it gets the resolution of the image, then sets the pylab figure size based off that. I'd also rather have this go through freetype, but the development time for that for me is >> (time left this afternoon). I'd be +1 to porting to freetype.
Okay, let's put that on the agenda but not pre-PR/merge. I seem to recall that freetype was put in originally so we *could* do colorbars like this, so it would be nice to deliver on that. The ticking code we use from matplotlib can be used here; right now it's put to use making colorbars in the browser (out of DIV elements, I think) in Reason. I'd be happy to work through this with you so we could get it going at some point down the road. For now, pylab it is!
This is _very_ loosely coupled to the interactive camera. I'm going to (right now) move it over to the general camera class, and make it have the API:
cam.save_annotated(fn, im=None, enhance=True)
This will take the filename, the previously produced image array or try to get the cam.image array (which exists for some variants of the camera), and then apply the standard deviation clipping that is presence in the enhance.py on the hub. I'm going to strongly encourage the enhance=True. I've been making movies that use the same normalization and have been happy with all of them.
While I'm at it, I'll add a cam.save(fn, im, enhance=True) that skips the annotation.
+/- 1 on those additions? Requests?
+1. Maybe this is inspiring enough to get that VR widget in Reason going ... :-) -Matt
All others: Thanks for the enthusiastic response!
Sam
On Fri, Jun 8, 2012 at 3:28 PM, Christopher Moody <cemoody@ucsc.edu> wrote:
Beautiful, +1!
chris
On Fri, Jun 8, 2012 at 2:22 PM, Cameron Hummels <chummels@astro.columbia.edu> wrote:
+1e6! I need to use something like this right now! :) Great work, Sam!
On 6/8/12 5:06 PM, Sam Skillman wrote:
Okay, I've prototyped something that works like this:
interactive_camera.snapshot() ...pops up interactive matplotlib window... interactive_camera.save('test.png') ...grabs all needed information and makes this...
Inline image 1
+/- 1? It just needs some cleanup, like reducing the extent of the colorbar so you don't get the black strip at the top and bottom of the image.
Sam
On Fri, Jun 8, 2012 at 2:12 PM, Richard P Wagner <rpwagner@sdsc.edu <mailto:rpwagner@sdsc.edu>> wrote:
On Jun 8, 2012, at 12:40 PM, Nathan Goldbaum wrote:
I'd prefer it if the transfer function plot were split into two separate frames. Right now, it's easy to think that the black background color image contains opacity information since the frame is plotted with a y axis. I'd prefer it if only the white line was plotted with a y axis and the black background image was plotted in a separate frame like a color bar with no y axis. This would also let the user see the tick marks for the opacity plot much more easily.
In general, I like plotting the transfer function like a color bar (sort of like Stella Offner's image on the yt homepage [http://yt-project.org/img/offner_etal.png]).
That's what came to mind when I was reading this. For a while, we've been putting a combination color bar-transfer function graphic in our renderings with ANL (skip about 30 seconds into http://www.youtube.com/watch?v=5dOt0IaRY4U). I think it's very natural to overlay a transfer function plot onto a color bar, and it provides a lot of information in a simple fashion.
--Rick
Nathan Goldbaum Graduate Student Astronomy & Astrophysics, UCSC goldbaum@ucolick.org <mailto:goldbaum@ucolick.org> http://www.ucolick.org/~goldbaum <http://www.ucolick.org/%7Egoldbaum>
On Jun 8, 2012, at 12:34 PM, Sam Skillman wrote:
Hi all,
I've been experimenting with different ways to plot the transfer functions, and in particular in the context of the InteractiveCamera.
What are people's thoughts about this behavior:
http://i.imgur.com/CGZ7Z.png http://i.imgur.com/OCsVt.jpg http://i.imgur.com/VNEse.png
btw, you can get this behavior by changing your script to call pf.h.interactive_camera, and then running in ipython with a working matplotlib backend.
I'll let Nathan bring up his concerns rather than me try to convey them.
Sam
!DSPAM:10175,4fd253db101042955315835! _______________________________________________ yt-dev mailing list yt-dev@lists.spacepope.org <mailto:yt-dev@lists.spacepope.org> http://lists.spacepope.org/listinfo.cgi/yt-dev-spacepope.org
!DSPAM:10175,4fd253db101042955315835!
_______________________________________________ yt-dev mailing list yt-dev@lists.spacepope.org <mailto:yt-dev@lists.spacepope.org> http://lists.spacepope.org/listinfo.cgi/yt-dev-spacepope.org
_______________________________________________ yt-dev mailing list yt-dev@lists.spacepope.org <mailto:yt-dev@lists.spacepope.org>
http://lists.spacepope.org/listinfo.cgi/yt-dev-spacepope.org
_______________________________________________ yt-dev mailing list yt-dev@lists.spacepope.org http://lists.spacepope.org/listinfo.cgi/yt-dev-spacepope.org
_______________________________________________ yt-dev mailing list yt-dev@lists.spacepope.org http://lists.spacepope.org/listinfo.cgi/yt-dev-spacepope.org
yt-dev mailing list yt-dev@lists.spacepope.org http://lists.spacepope.org/listinfo.cgi/yt-dev-spacepope.org
_______________________________________________ yt-dev mailing list yt-dev@lists.spacepope.org http://lists.spacepope.org/listinfo.cgi/yt-dev-spacepope.org
+1 Looks good! From G.S. On Fri, Jun 8, 2012 at 2:59 PM, Matthew Turk <matthewturk@gmail.com> wrote:
Hi Sam,
Matt:
I'm using pylab. One thing I'm going to change is modify it so that it gets the resolution of the image, then sets the pylab figure size based off
On Fri, Jun 8, 2012 at 5:30 PM, Sam Skillman <samskillman@gmail.com> wrote: that.
I'd also rather have this go through freetype, but the development time for that for me is >> (time left this afternoon). I'd be +1 to porting to freetype.
Okay, let's put that on the agenda but not pre-PR/merge. I seem to recall that freetype was put in originally so we *could* do colorbars like this, so it would be nice to deliver on that. The ticking code we use from matplotlib can be used here; right now it's put to use making colorbars in the browser (out of DIV elements, I think) in Reason. I'd be happy to work through this with you so we could get it going at some point down the road. For now, pylab it is!
This is _very_ loosely coupled to the interactive camera. I'm going to (right now) move it over to the general camera class, and make it have
the
API:
cam.save_annotated(fn, im=None, enhance=True)
This will take the filename, the previously produced image array or try to get the cam.image array (which exists for some variants of the camera), and then apply the standard deviation clipping that is presence in the enhance.py on the hub. I'm going to strongly encourage the enhance=True. I've been making movies that use the same normalization and have been happy with all of them.
While I'm at it, I'll add a cam.save(fn, im, enhance=True) that skips the annotation.
+/- 1 on those additions? Requests?
+1.
Maybe this is inspiring enough to get that VR widget in Reason going ... :-)
-Matt
All others: Thanks for the enthusiastic response!
Sam
On Fri, Jun 8, 2012 at 3:28 PM, Christopher Moody <cemoody@ucsc.edu>
Beautiful, +1!
chris
On Fri, Jun 8, 2012 at 2:22 PM, Cameron Hummels <chummels@astro.columbia.edu> wrote:
+1e6! I need to use something like this right now! :) Great work,
Sam!
On 6/8/12 5:06 PM, Sam Skillman wrote:
Okay, I've prototyped something that works like this:
interactive_camera.snapshot() ...pops up interactive matplotlib window... interactive_camera.save('test.png') ...grabs all needed information and makes this...
Inline image 1
+/- 1? It just needs some cleanup, like reducing the extent of the colorbar so you don't get the black strip at the top and bottom of
wrote: the
image.
Sam
On Fri, Jun 8, 2012 at 2:12 PM, Richard P Wagner <rpwagner@sdsc.edu <mailto:rpwagner@sdsc.edu>> wrote:
On Jun 8, 2012, at 12:40 PM, Nathan Goldbaum wrote:
I'd prefer it if the transfer function plot were split into two separate frames. Right now, it's easy to think that the black background color image contains opacity information since the frame is plotted with a y axis. I'd prefer it if only the white line was plotted with a y axis and the black background image was plotted in a separate frame like a color bar with no y axis. This would also let the user see the tick marks for the opacity plot much more easily.
In general, I like plotting the transfer function like a color bar (sort of like Stella Offner's image on the yt homepage [http://yt-project.org/img/offner_etal.png]).
That's what came to mind when I was reading this. For a while, we've been putting a combination color bar-transfer function graphic in our renderings with ANL (skip about 30 seconds into http://www.youtube.com/watch?v=5dOt0IaRY4U). I think it's very natural to overlay a transfer function plot onto a color bar, and it provides a lot of information in a simple fashion.
--Rick
Nathan Goldbaum Graduate Student Astronomy & Astrophysics, UCSC goldbaum@ucolick.org <mailto:goldbaum@ucolick.org> http://www.ucolick.org/~goldbaum <http://www.ucolick.org/%7Egoldbaum>
On Jun 8, 2012, at 12:34 PM, Sam Skillman wrote:
> Hi all, > > I've been experimenting with different ways to plot the transfer > functions, and in particular in the context of the > InteractiveCamera. > > What are people's thoughts about this behavior: > > http://i.imgur.com/CGZ7Z.png > http://i.imgur.com/OCsVt.jpg > http://i.imgur.com/VNEse.png > > btw, you can get this behavior by changing your script to call > pf.h.interactive_camera, and then running in ipython with a > working matplotlib backend. > > I'll let Nathan bring up his concerns rather than me try to > convey them. > > Sam > > > > !DSPAM:10175,4fd253db101042955315835! > _______________________________________________ > yt-dev mailing list > yt-dev@lists.spacepope.org <mailto:yt-dev@lists.spacepope.org> > http://lists.spacepope.org/listinfo.cgi/yt-dev-spacepope.org > > > !DSPAM:10175,4fd253db101042955315835!
_______________________________________________ yt-dev mailing list yt-dev@lists.spacepope.org <mailto:yt-dev@lists.spacepope.org> http://lists.spacepope.org/listinfo.cgi/yt-dev-spacepope.org
_______________________________________________ yt-dev mailing list yt-dev@lists.spacepope.org <mailto:yt-dev@lists.spacepope.org>
http://lists.spacepope.org/listinfo.cgi/yt-dev-spacepope.org
_______________________________________________ yt-dev mailing list yt-dev@lists.spacepope.org http://lists.spacepope.org/listinfo.cgi/yt-dev-spacepope.org
_______________________________________________ yt-dev mailing list yt-dev@lists.spacepope.org http://lists.spacepope.org/listinfo.cgi/yt-dev-spacepope.org
yt-dev mailing list yt-dev@lists.spacepope.org http://lists.spacepope.org/listinfo.cgi/yt-dev-spacepope.org
_______________________________________________ yt-dev mailing list yt-dev@lists.spacepope.org http://lists.spacepope.org/listinfo.cgi/yt-dev-spacepope.org
_______________________________________________ yt-dev mailing list yt-dev@lists.spacepope.org http://lists.spacepope.org/listinfo.cgi/yt-dev-spacepope.org
participants (8)
-
 Cameron Hummels
 -
 Christopher Moody
 -
 Geoffrey So
 -
 Matthew Turk
 -
 Nathan Goldbaum
 -
 Richard P Wagner
 -
 Sam Skillman
 -
 Stephen Skory