
I expect what's happening is that there's less than an order of magnitude
of variation between the extremes of the colorbar, so no tick marks get
displayed.
Can you try switching to a linear colorbar scaling? Something like
"p.set_log('sn_metal_density', False)" should do the trick.
On Wed, Aug 23, 2017 at 7:04 PM, Clayton Strawn
Hello,
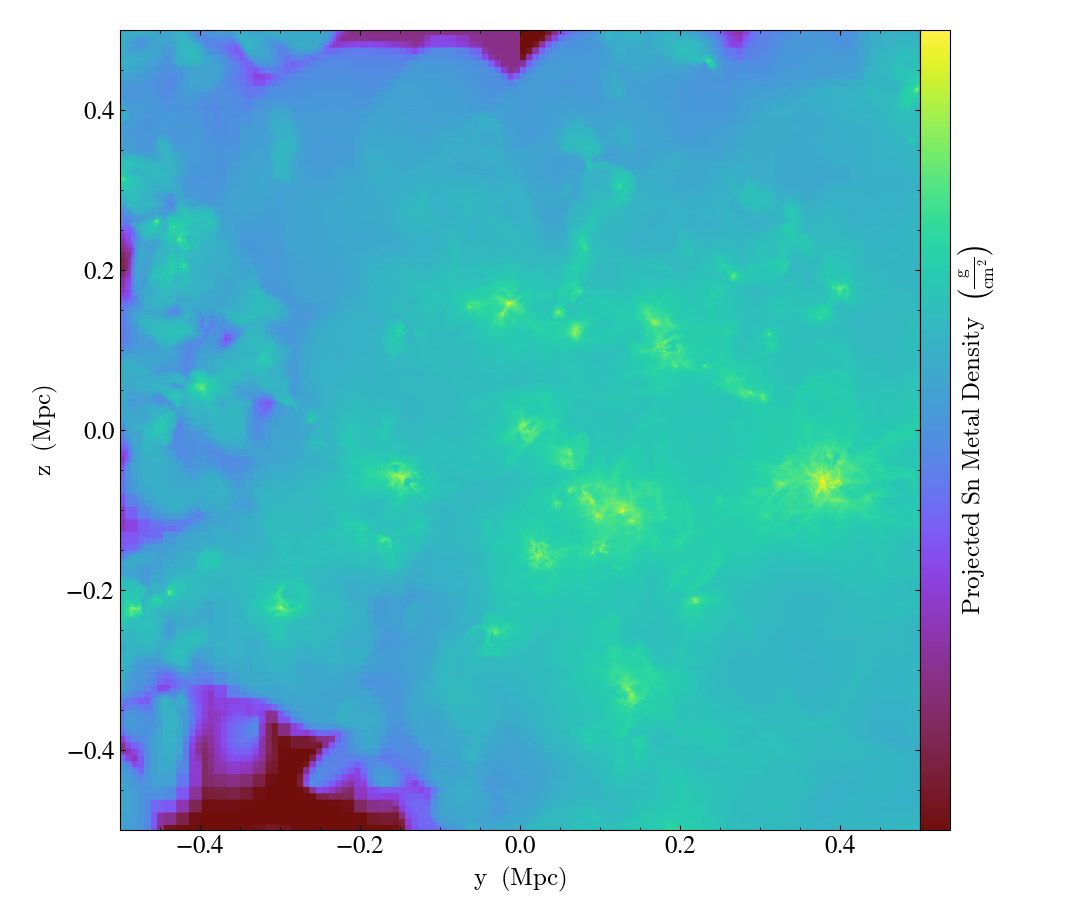
I'm trying to define a new metal field and compare to the old, but the new field doesn't have any numbers on the colorbar! Changing units and setting minorticks "on" didn't help with this. [image: Inline image 1][image: Inline image 2] import yt filename = "/Users/file_name_vela_sim.d" ds = yt.load(filename)
def _SN_metal_dens(field, data): return data[('gas','metal_ia_density')]+ data[('gas','metal_ii_density')] yt.add_field(("gas", "sn_metal_density"), function=_SN_metal_dens, units="g/cm**3")
p1 = yt.ProjectionPlot(ds,0,("gas", "sn_metal_density"), width = (1, "Mpc")) p2 = yt.ProjectionPlot(ds,0,("gas", "metal_density"), width = (1, "Mpc")) p1.set_cbar_minorticks(("gas", "sn_metal_density"),"on") p2.set_cbar_minorticks(("gas", "metal_density"),"on") p1.set_unit(("gas", "sn_metal_density"), 'g/cm**2') p1.save() p2.save()
How do I get a normal colorbar plot with numbers with a user-defined field? -- Physics Department UC Santa Cruz 1156 HIGH STREET, SANTA CRUZ, CA 95064 916-749-2940 <(916)%20749-2940>
_______________________________________________ yt-users mailing list yt-users@lists.spacepope.org http://lists.spacepope.org/listinfo.cgi/yt-users-spacepope.org