Re: [yt-users] yt-users Digest, Vol 119, Issue 4

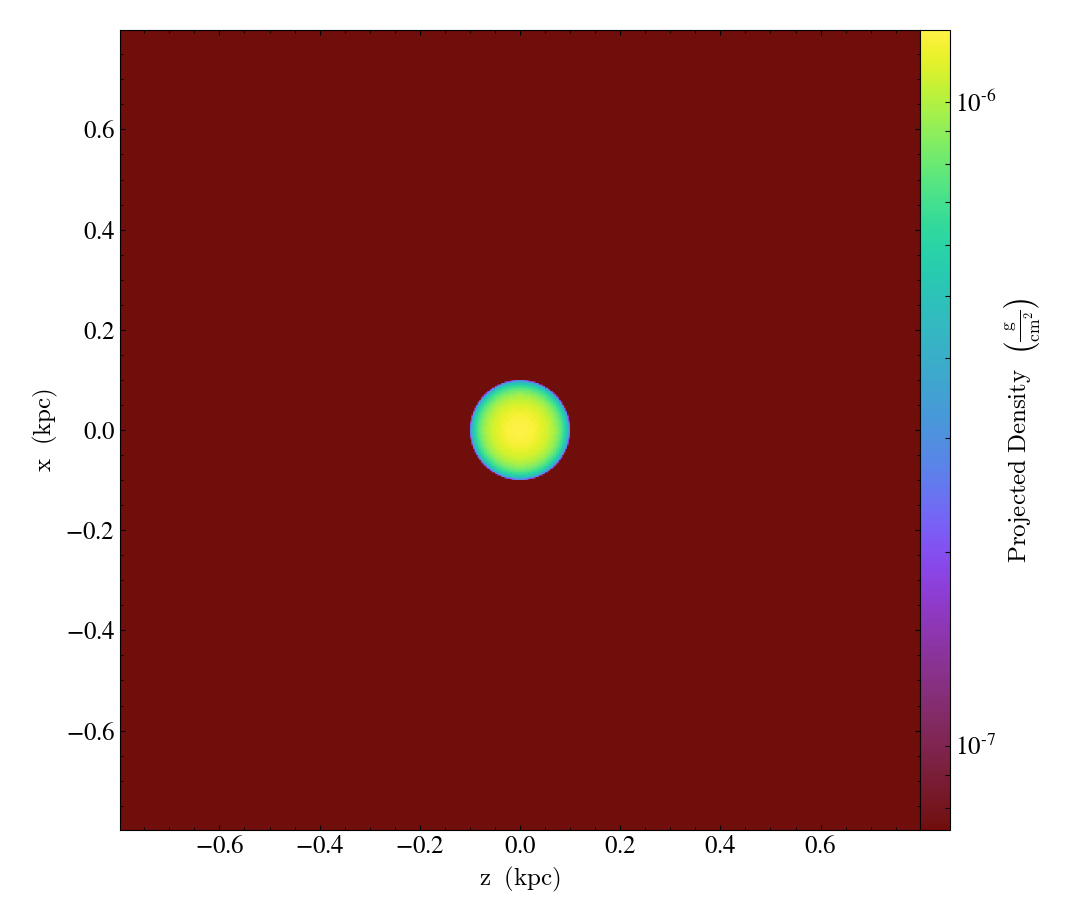
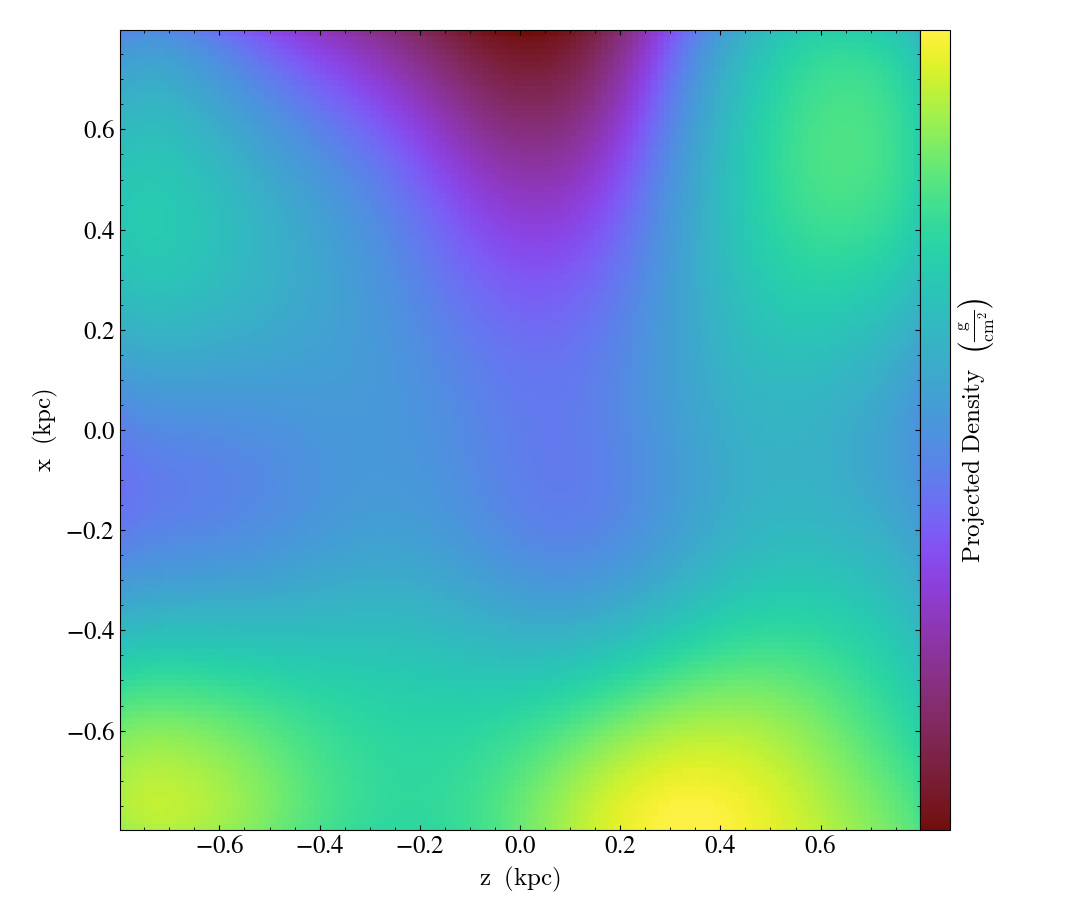
Hi Suoqing and all, I tried following the examples for projection generation that are shown in the yt manual but my plots are still not coming out as desired. The first three plots I have plotted are indicated below. Plots for checkpoints 1 and 2 are fine but checkpoint 3 and others that follow are coming out as either extreme zoomed in or distorted. Any ideas how I might correct this? Thank you, Kezman 1st checkpoint 2nd checkpoint 3rd checkpoint [image: Inline image 4] [image: Inline image 2] [image: Inline image 1] Kezman Saboi Barrett Honors College|Arizona State University Astrophysics Phone|480-819-5031 On Thu, Jan 4, 2018 at 12:39 AM, <yt-users-request@lists.spacepope.org> wrote:
Send yt-users mailing list submissions to yt-users@lists.spacepope.org
To subscribe or unsubscribe via the World Wide Web, visit http://lists.spacepope.org/listinfo.cgi/yt-users-spacepope.org or, via email, send a message with subject or body 'help' to yt-users-request@lists.spacepope.org
You can reach the person managing the list at yt-users-owner@lists.spacepope.org
When replying, please edit your Subject line so it is more specific than "Re: Contents of yt-users digest..."
Today's Topics:
1. Re: Tracking a blob (Suoqing Ji)
----------------------------------------------------------------------
Message: 1 Date: Wed, 3 Jan 2018 13:49:45 -0800 From: Suoqing Ji <suoqing@physics.ucsb.edu> To: Discussion of the yt analysis package <yt-users@lists.spacepope.org> Subject: Re: [yt-users] Tracking a blob Message-ID: <4D51786E-22B3-4F62-938E-A6CE8B2387F9@physics.ucsb.edu> Content-Type: text/plain; charset="utf-8"
Hi Kezman,
?origin? specifies the axis and your plot domain, and what you?re looking for is the ?center? parameter, and provide the coordinates of the blob to the parameter ?center?. You can find some similar SlicePlot examples with a specified plot center here: http://yt-project.org/docs/ dev/visualizing/plots.html#slice-plots <http://yt-project.org/docs/ dev/visualizing/plots.html#slice-plots>
Best wishes, ? Suoqing JI Ph.D Candidate Department of Physics University of California, Santa Barbara http://physics.ucsb.edu/~suoqing
On Jan 3, 2018, at 12:30 PM, Kezman Saboi <ksaboi@asu.edu> wrote:
Hi,
I am trying to create projections of a blob (a gas cloud) that is in motion but I keep on having problems with plotting it such that it is at the center of the plot. I have tried using origin = 'native' but it does not seem to be helping. Could anyone please offer guidance?
Thank you,
Kezman Saboi Barrett Honors College|Arizona State University Astrophysics Phone|480-819-5031 _______________________________________________ yt-users mailing list yt-users@lists.spacepope.org http://lists.spacepope.org/listinfo.cgi/yt-users-spacepope.org
-------------- next part -------------- An HTML attachment was scrubbed... URL: <http://lists.spacepope.org/pipermail/yt-users-spacepope. org/attachments/20180103/eab58eea/attachment-0001.html>
------------------------------
Subject: Digest Footer
_______________________________________________ yt-users mailing list yt-users@lists.spacepope.org http://lists.spacepope.org/listinfo.cgi/yt-users-spacepope.org
------------------------------
End of yt-users Digest, Vol 119, Issue 4 ****************************************

Hi Kezman, Judging from the spatial scale of the plots, I think there’s no zoom in here. Since I see there’s a sharp drop in density, my naive guess is either the blob is completely destroyed, or you lose tracking the blob (maybe due to deceleration). My suggestion is that before tracking an individual blob, just plot the entire domain, then you’ll have a sense of what’s going on, and then you could determine the location of blob and track it easily. Btw, you could also set origin=‘native’ (as you did previously), which will display the absolute coordinates in the plots and help to clarify the issue. Let me know if it did not work! Best wishes, — Suoqing JI Ph.D Candidate Department of Physics University of California, Santa Barbara http://physics.ucsb.edu/~suoqing
On Jan 16, 2018, at 4:19 PM, Kezman Saboi <ksaboi@asu.edu> wrote:
Hi Suoqing and all,
I tried following the examples for projection generation that are shown in the yt manual but my plots are still not coming out as desired. The first three plots I have plotted are indicated below. Plots for checkpoints 1 and 2 are fine but checkpoint 3 and others that follow are coming out as either extreme zoomed in or distorted. Any ideas how I might correct this?
Thank you,
Kezman
1st checkpoint 2nd checkpoint 3rd checkpoint <0pplot_Projection_y_density.png> <pplot_Projection_y_density.png> <2pplot_Projection_y_density.png>
Kezman Saboi Barrett Honors College|Arizona State University Astrophysics Phone|480-819-5031
On Thu, Jan 4, 2018 at 12:39 AM, <yt-users-request@lists.spacepope.org <mailto:yt-users-request@lists.spacepope.org>> wrote: Send yt-users mailing list submissions to yt-users@lists.spacepope.org <mailto:yt-users@lists.spacepope.org>
To subscribe or unsubscribe via the World Wide Web, visit http://lists.spacepope.org/listinfo.cgi/yt-users-spacepope.org <http://lists.spacepope.org/listinfo.cgi/yt-users-spacepope.org> or, via email, send a message with subject or body 'help' to yt-users-request@lists.spacepope.org <mailto:yt-users-request@lists.spacepope.org>
You can reach the person managing the list at yt-users-owner@lists.spacepope.org <mailto:yt-users-owner@lists.spacepope.org>
When replying, please edit your Subject line so it is more specific than "Re: Contents of yt-users digest..."
Today's Topics:
1. Re: Tracking a blob (Suoqing Ji)
----------------------------------------------------------------------
Message: 1 Date: Wed, 3 Jan 2018 13:49:45 -0800 From: Suoqing Ji <suoqing@physics.ucsb.edu <mailto:suoqing@physics.ucsb.edu>> To: Discussion of the yt analysis package <yt-users@lists.spacepope.org <mailto:yt-users@lists.spacepope.org>> Subject: Re: [yt-users] Tracking a blob Message-ID: <4D51786E-22B3-4F62-938E-A6CE8B2387F9@physics.ucsb.edu <mailto:4D51786E-22B3-4F62-938E-A6CE8B2387F9@physics.ucsb.edu>> Content-Type: text/plain; charset="utf-8"
Hi Kezman,
?origin? specifies the axis and your plot domain, and what you?re looking for is the ?center? parameter, and provide the coordinates of the blob to the parameter ?center?. You can find some similar SlicePlot examples with a specified plot center here: http://yt-project.org/docs/dev/visualizing/plots.html#slice-plots <http://yt-project.org/docs/dev/visualizing/plots.html#slice-plots> <http://yt-project.org/docs/dev/visualizing/plots.html#slice-plots <http://yt-project.org/docs/dev/visualizing/plots.html#slice-plots>>
Best wishes, ? Suoqing JI Ph.D Candidate Department of Physics University of California, Santa Barbara http://physics.ucsb.edu/~suoqing <http://physics.ucsb.edu/~suoqing>
On Jan 3, 2018, at 12:30 PM, Kezman Saboi <ksaboi@asu.edu <mailto:ksaboi@asu.edu>> wrote:
Hi,
I am trying to create projections of a blob (a gas cloud) that is in motion but I keep on having problems with plotting it such that it is at the center of the plot. I have tried using origin = 'native' but it does not seem to be helping. Could anyone please offer guidance?
Thank you,
Kezman Saboi Barrett Honors College|Arizona State University Astrophysics Phone|480-819-5031 <tel:480-819-5031> _______________________________________________ yt-users mailing list yt-users@lists.spacepope.org <mailto:yt-users@lists.spacepope.org> http://lists.spacepope.org/listinfo.cgi/yt-users-spacepope.org <http://lists.spacepope.org/listinfo.cgi/yt-users-spacepope.org>
-------------- next part -------------- An HTML attachment was scrubbed... URL: <http://lists.spacepope.org/pipermail/yt-users-spacepope.org/attachments/2018... <http://lists.spacepope.org/pipermail/yt-users-spacepope.org/attachments/20180103/eab58eea/attachment-0001.html>>
------------------------------
Subject: Digest Footer
_______________________________________________ yt-users mailing list yt-users@lists.spacepope.org <mailto:yt-users@lists.spacepope.org> http://lists.spacepope.org/listinfo.cgi/yt-users-spacepope.org <http://lists.spacepope.org/listinfo.cgi/yt-users-spacepope.org>
------------------------------
End of yt-users Digest, Vol 119, Issue 4 ****************************************
_______________________________________________ yt-users mailing list yt-users@lists.spacepope.org http://lists.spacepope.org/listinfo.cgi/yt-users-spacepope.org
participants (2)
-
 Kezman Saboi
 -
 Suoqing Ji