Wanting to take a FFT transform of a irregularly spaced sample

Hello, I have looked at both these answers from SO - https://stackoverflow.com/questions/34428886/discrete-fourier-transformation... and https://stackoverflow.com/questions/25735153/plotting-a-fast-fourier-transfo... My question is somewhat similar. I have data from a CSV file that has measurements of a mean sea level pressure. The data is available every 5 minutes. That means 8928 sample points over a month. But during a hurricane event there was a power failure and only 8867 data points are available. I am short by 61 points to get a uniformly spaced sample. I am wanting to take an FFT of the data in order to check for periodicity, waves and frequencies there of. What are my best options ? Best regards, Ashwin.

On Mon, Apr 11, 2022 at 11:38 PM ashwin .D <winash12@gmail.com> wrote:
Hello, I have looked at both these answers from SO - https://stackoverflow.com/questions/34428886/discrete-fourier-transformation... and https://stackoverflow.com/questions/25735153/plotting-a-fast-fourier-transfo...
My question is somewhat similar. I have data from a CSV file that has measurements of a mean sea level pressure. The data is available every 5 minutes. That means 8928 sample points over a month. But during a hurricane event there was a power failure and only 8867 data points are available. I am short by 61 points to get a uniformly spaced sample. I am wanting to take an FFT of the data in order to check for periodicity, waves and frequencies there of. What are my best options ?
The first SO answer is reliable (the second is mostly useless for the kind of gap you are talking about); the Lomb-Scargle periodogram is a very reasonable way to do the task. To answer those questions, you will likely want a periodogram, not the more fundamental Fourier transform. But if you do want a full complex-valued Fourier transform for whatever reason, `nfft` should do the job: https://github.com/jakevdp/nfft/ -- Robert Kern
Hi Robert, Thanks for your prompt response. I am going to try both. Regarding this answer that you recommended - https://stackoverflow.com/questions/34428886/discrete-fourier-transformation... what would be my angular frequencies from this API - https://docs.scipy.org/doc/scipy/reference/generated/scipy.signal.lombscargl... ? The x and y arguments are straightforward and are available to me from the CSV file. What about the third one ? On Tue, Apr 12, 2022 at 9:48 AM Robert Kern <robert.kern@gmail.com> wrote:
On Mon, Apr 11, 2022 at 11:38 PM ashwin .D <winash12@gmail.com> wrote:
Hello, I have looked at both these answers from SO - https://stackoverflow.com/questions/34428886/discrete-fourier-transformation... and https://stackoverflow.com/questions/25735153/plotting-a-fast-fourier-transfo...
My question is somewhat similar. I have data from a CSV file that has measurements of a mean sea level pressure. The data is available every 5 minutes. That means 8928 sample points over a month. But during a hurricane event there was a power failure and only 8867 data points are available. I am short by 61 points to get a uniformly spaced sample. I am wanting to take an FFT of the data in order to check for periodicity, waves and frequencies there of. What are my best options ?
The first SO answer is reliable (the second is mostly useless for the kind of gap you are talking about); the Lomb-Scargle periodogram is a very reasonable way to do the task. To answer those questions, you will likely want a periodogram, not the more fundamental Fourier transform. But if you do want a full complex-valued Fourier transform for whatever reason, `nfft` should do the job:
https://github.com/jakevdp/nfft/
-- Robert Kern _______________________________________________ SciPy-User mailing list -- scipy-user@python.org To unsubscribe send an email to scipy-user-leave@python.org https://mail.python.org/mailman3/lists/scipy-user.python.org/ Member address: winash12@gmail.com
On Tue, Apr 12, 2022 at 3:32 AM ashwin .D <winash12@gmail.com> wrote:
Hi Robert, Thanks for your prompt response. I am going to try both. Regarding this answer that you recommended - https://stackoverflow.com/questions/34428886/discrete-fourier-transformation...
what would be my angular frequencies from this API - https://docs.scipy.org/doc/scipy/reference/generated/scipy.signal.lombscargl... ?
The x and y arguments are straightforward and are available to me from the CSV file. What about the third one ?
That's the angular frequencies at which you want to evaluate the periodogram at. In your case (otherwise-regular time series but with missing values), I would recommend using the angular frequencies that you would have had if you had computed a normal periodogram using the FFT on the whole time series, e.g. `np.linspace(0, np.pi/300.0, 8928//2)` (assuming your `x` is in seconds). The running time is O(len(x)*len(freqs)), though, so that may take a long time. You may want to reduce the number of points you sample at first for visualization, then you can zoom in at the full frequency resolution to an area of interest if there is lots of dead space. -- Robert Kern
Robert, I ran that code as you suggested. I get this error now - File "ffttest.py", line 21, in <module> signal.lombscargle(minutes,df1.to_numpy().ravel(),freq) File "/usr/local/lib/python3.8/dist-packages/scipy-1.7.1-py3.8-linux-x86_64.egg/scipy/signal/spectral.py", line 150, in lombscargle pgram = _lombscargle(x, y, freqs) ZeroDivisionError: () Any suggestions would be appreciated. Is this an issue I should open on github by providing the test data ? Best regards, Ashwin. On Tue, Apr 12, 2022 at 6:48 PM Robert Kern <robert.kern@gmail.com> wrote:
On Tue, Apr 12, 2022 at 3:32 AM ashwin .D <winash12@gmail.com> wrote:
Hi Robert, Thanks for your prompt response. I am going to try both. Regarding this answer that you recommended - https://stackoverflow.com/questions/34428886/discrete-fourier-transformation...
what would be my angular frequencies from this API - https://docs.scipy.org/doc/scipy/reference/generated/scipy.signal.lombscargl... ?
The x and y arguments are straightforward and are available to me from the CSV file. What about the third one ?
That's the angular frequencies at which you want to evaluate the periodogram at. In your case (otherwise-regular time series but with missing values), I would recommend using the angular frequencies that you would have had if you had computed a normal periodogram using the FFT on the whole time series, e.g. `np.linspace(0, np.pi/300.0, 8928//2)` (assuming your `x` is in seconds). The running time is O(len(x)*len(freqs)), though, so that may take a long time. You may want to reduce the number of points you sample at first for visualization, then you can zoom in at the full frequency resolution to an area of interest if there is lots of dead space.
-- Robert Kern _______________________________________________ SciPy-User mailing list -- scipy-user@python.org To unsubscribe send an email to scipy-user-leave@python.org https://mail.python.org/mailman3/lists/scipy-user.python.org/ Member address: winash12@gmail.com
Based on this github issue I had to make one modification - https://github.com/scipy/scipy/issues/13812 as shown below. I had to remove the zero frequency signal.lombscargle(minutes,df1.to_numpy().ravel(),freq[1:]) and the code works just fine now. The interpretation task awaits me now . For the record here is the code - times = df.view(np.int64)/6E10 df1 = (data[['Pressure_hPa']]) # I also added a 2 to the angular frequency value freq = np.linspace(0, 2*np.pi/300.0,8928//2) signal.lombscargle(times,df1.to_numpy().ravel(),freq[1:]) On Wed, Apr 13, 2022 at 7:46 PM ashwin .D <winash12@gmail.com> wrote:
Robert, I ran that code as you suggested. I get this error now - File "ffttest.py", line 21, in <module> signal.lombscargle(minutes,df1.to_numpy().ravel(),freq) File "/usr/local/lib/python3.8/dist-packages/scipy-1.7.1-py3.8-linux-x86_64.egg/scipy/signal/spectral.py", line 150, in lombscargle pgram = _lombscargle(x, y, freqs) ZeroDivisionError: ()
Any suggestions would be appreciated. Is this an issue I should open on github by providing the test data ?
Best regards, Ashwin.
On Tue, Apr 12, 2022 at 6:48 PM Robert Kern <robert.kern@gmail.com> wrote:
On Tue, Apr 12, 2022 at 3:32 AM ashwin .D <winash12@gmail.com> wrote:
Hi Robert, Thanks for your prompt response. I am going to try both. Regarding this answer that you recommended - https://stackoverflow.com/questions/34428886/discrete-fourier-transformation...
what would be my angular frequencies from this API - https://docs.scipy.org/doc/scipy/reference/generated/scipy.signal.lombscargl... ?
The x and y arguments are straightforward and are available to me from the CSV file. What about the third one ?
That's the angular frequencies at which you want to evaluate the periodogram at. In your case (otherwise-regular time series but with missing values), I would recommend using the angular frequencies that you would have had if you had computed a normal periodogram using the FFT on the whole time series, e.g. `np.linspace(0, np.pi/300.0, 8928//2)` (assuming your `x` is in seconds). The running time is O(len(x)*len(freqs)), though, so that may take a long time. You may want to reduce the number of points you sample at first for visualization, then you can zoom in at the full frequency resolution to an area of interest if there is lots of dead space.
-- Robert Kern _______________________________________________ SciPy-User mailing list -- scipy-user@python.org To unsubscribe send an email to scipy-user-leave@python.org https://mail.python.org/mailman3/lists/scipy-user.python.org/ Member address: winash12@gmail.com
On Wed, Apr 13, 2022 at 10:34 AM ashwin .D <winash12@gmail.com> wrote:
Based on this github issue I had to make one modification - https://github.com/scipy/scipy/issues/13812 as shown below. I had to remove the zero frequency signal.lombscargle(minutes,df1.to_numpy().ravel(),freq[1:])
Indeed. Sorry, I have not actually used lombscargle() in anger, and that requirement is not mentioned in the docstring (though it is manifest in the example).
and the code works just fine now. The interpretation task awaits me now .
For the record here is the code -
times = df.view(np.int64)/6E10
df1 = (data[['Pressure_hPa']])
# I also added a 2 to the angular frequency value freq = np.linspace(0, 2*np.pi/300.0,8928//2)
You only want to go up to the Nyquist frequency of the original sampling. If `times` is in units of seconds and the sampling period is 5 minutes (300s), then the (angular) Nyquist frequency is np.pi/300. -- Robert Kern
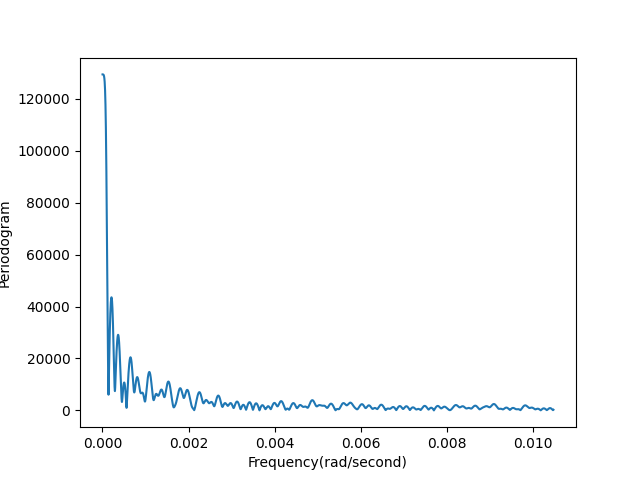
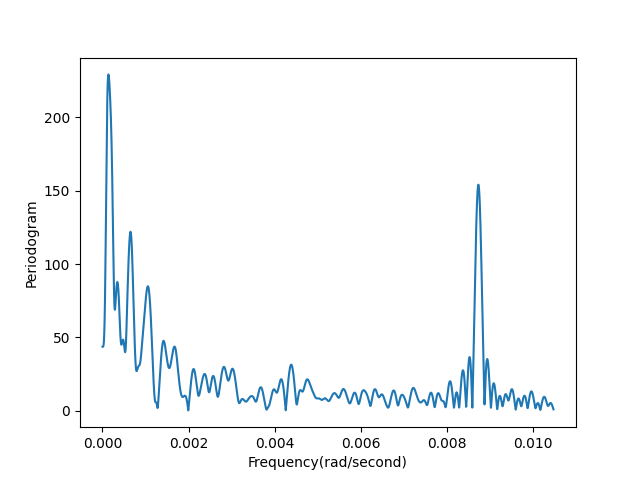
Robert, Thanks. I have enclosed the results for your interest. So x.png is the untrended plot of periodogram vs. frequency. Note the spike near the low frequency area of the x axis(close to zero). Those I believe are the atmospheric tides( https://patarnott.com/atms411/pdf/class2018/atmosTides.pdf__. But the detrended plot has a richer zoo of frequencies including some higher frequency ones while at the same time reproducing the atmospheric tides. I had one final question. In this peer reviewed paper (figure 4) https://journals.ametsoc.org/view/journals/apme/57/10/jamc-d-17-0250.1.xml they calculate the phase of the Lomb Scargel periodogram. I checked the scipy API for that but it does not seem to be available. It is available in the gatspy/astropy packages https://stackoverflow.com/questions/49859075/lomb-scargle-phase. Is that the better way to go then ? On Wed, Apr 13, 2022 at 8:24 PM Robert Kern <robert.kern@gmail.com> wrote:
On Wed, Apr 13, 2022 at 10:34 AM ashwin .D <winash12@gmail.com> wrote:
Based on this github issue I had to make one modification - https://github.com/scipy/scipy/issues/13812 as shown below. I had to remove the zero frequency signal.lombscargle(minutes,df1.to_numpy().ravel(),freq[1:])
Indeed. Sorry, I have not actually used lombscargle() in anger, and that requirement is not mentioned in the docstring (though it is manifest in the example).
and the code works just fine now. The interpretation task awaits me now .
For the record here is the code -
times = df.view(np.int64)/6E10
df1 = (data[['Pressure_hPa']])
# I also added a 2 to the angular frequency value freq = np.linspace(0, 2*np.pi/300.0,8928//2)
You only want to go up to the Nyquist frequency of the original sampling. If `times` is in units of seconds and the sampling period is 5 minutes (300s), then the (angular) Nyquist frequency is np.pi/300.
-- Robert Kern _______________________________________________ SciPy-User mailing list -- scipy-user@python.org To unsubscribe send an email to scipy-user-leave@python.org https://mail.python.org/mailman3/lists/scipy-user.python.org/ Member address: winash12@gmail.com
On Fri, Apr 15, 2022 at 6:29 AM ashwin .D <winash12@gmail.com> wrote:
Robert, Thanks. I have enclosed the results for your interest. So x.png is the untrended plot of periodogram vs. frequency. Note the spike near the low frequency area of the x axis(close to zero). Those I believe are the atmospheric tides( https://patarnott.com/atms411/pdf/class2018/atmosTides.pdf__. But the detrended plot has a richer zoo of frequencies including some higher frequency ones while at the same time reproducing the atmospheric tides.
I had one final question. In this peer reviewed paper (figure 4) https://journals.ametsoc.org/view/journals/apme/57/10/jamc-d-17-0250.1.xml they calculate the phase of the Lomb Scargel periodogram. I checked the scipy API for that but it does not seem to be available. It is available in the gatspy/astropy packages https://stackoverflow.com/questions/49859075/lomb-scargle-phase. Is that the better way to go then ?
They don't implement the Lomb-Scargle DFT as presented in that paper. They do have some facility for helping you find the important peaks from the periodogram and then help you do a least-squares fit to a sinusoidal model with those fixed frequencies to get the phases. Which may be all you need. The NFFT that I mentioned might be closer (if not identical; I haven't read too deeply) to the LS-DFT. -- Robert Kern
Robert, When you write "you may want to reduce the number of points you sample at first for visualization, then you can zoom in at the full frequency resolution to an area of interest if there is lots of dead space." are you referring to the https://en.wikipedia.org/wiki/Welch%27s_method and implemented by https://docs.scipy.org/doc/scipy/reference/generated/scipy.signal.welch.html ? This provides for an efficient noise reduction . On Tue, Apr 12, 2022 at 6:48 PM Robert Kern <robert.kern@gmail.com> wrote:
On Tue, Apr 12, 2022 at 3:32 AM ashwin .D <winash12@gmail.com> wrote:
Hi Robert, Thanks for your prompt response. I am going to try both. Regarding this answer that you recommended - https://stackoverflow.com/questions/34428886/discrete-fourier-transformation...
what would be my angular frequencies from this API - https://docs.scipy.org/doc/scipy/reference/generated/scipy.signal.lombscargl... ?
The x and y arguments are straightforward and are available to me from the CSV file. What about the third one ?
That's the angular frequencies at which you want to evaluate the periodogram at. In your case (otherwise-regular time series but with missing values), I would recommend using the angular frequencies that you would have had if you had computed a normal periodogram using the FFT on the whole time series, e.g. `np.linspace(0, np.pi/300.0, 8928//2)` (assuming your `x` is in seconds). The running time is O(len(x)*len(freqs)), though, so that may take a long time. You may want to reduce the number of points you sample at first for visualization, then you can zoom in at the full frequency resolution to an area of interest if there is lots of dead space.
-- Robert Kern _______________________________________________ SciPy-User mailing list -- scipy-user@python.org To unsubscribe send an email to scipy-user-leave@python.org https://mail.python.org/mailman3/lists/scipy-user.python.org/ Member address: winash12@gmail.com
However I do not think the functionality is available right now. What I want is to segment wise frequency estimate with Lomb Scargle. That would be a PR am I right ? On Mon, May 16, 2022 at 5:24 PM ashwin .D <winash12@gmail.com> wrote:
Robert, When you write "you may want to reduce the number of points you sample at first for visualization, then you can zoom in at the full frequency resolution to an area of interest if there is lots of dead space." are you referring to the https://en.wikipedia.org/wiki/Welch%27s_method and implemented by https://docs.scipy.org/doc/scipy/reference/generated/scipy.signal.welch.html ? This provides for an efficient noise reduction .
On Tue, Apr 12, 2022 at 6:48 PM Robert Kern <robert.kern@gmail.com> wrote:
On Tue, Apr 12, 2022 at 3:32 AM ashwin .D <winash12@gmail.com> wrote:
Hi Robert, Thanks for your prompt response. I am going to try both. Regarding this answer that you recommended - https://stackoverflow.com/questions/34428886/discrete-fourier-transformation...
what would be my angular frequencies from this API - https://docs.scipy.org/doc/scipy/reference/generated/scipy.signal.lombscargl... ?
The x and y arguments are straightforward and are available to me from the CSV file. What about the third one ?
That's the angular frequencies at which you want to evaluate the periodogram at. In your case (otherwise-regular time series but with missing values), I would recommend using the angular frequencies that you would have had if you had computed a normal periodogram using the FFT on the whole time series, e.g. `np.linspace(0, np.pi/300.0, 8928//2)` (assuming your `x` is in seconds). The running time is O(len(x)*len(freqs)), though, so that may take a long time. You may want to reduce the number of points you sample at first for visualization, then you can zoom in at the full frequency resolution to an area of interest if there is lots of dead space.
-- Robert Kern _______________________________________________ SciPy-User mailing list -- scipy-user@python.org To unsubscribe send an email to scipy-user-leave@python.org https://mail.python.org/mailman3/lists/scipy-user.python.org/ Member address: winash12@gmail.com
On Mon, May 16, 2022 at 7:57 AM ashwin .D <winash12@gmail.com> wrote:
Robert, When you write "you may want to reduce the number of points you sample at first for visualization, then you can zoom in at the full frequency resolution to an area of interest if there is lots of dead space." are you referring to the https://en.wikipedia.org/wiki/Welch%27s_method and implemented by https://docs.scipy.org/doc/scipy/reference/generated/scipy.signal.welch.html ? This provides for an efficient noise reduction .
No, I just meant that you get to pick the array of frequencies that the periodogram is sampled on. You can pick anything (that doesn't include f=0), so you could start with a coarse sampling to see where the major frequency content is. Then if the frequency content is constrained to one region, then you can choose a finer sampling of frequencies only within that band. That can save on computation costs if it's too expensive to do a fine sampling over the whole Nyquist range. But if it's cheap enough to do the fine sampling over the whole region, go ahead and do that. I don't know of any work that apply's something like Welch's method per se to the LS periodogram, but if you squint, you can kind of see Welch's method as an ad hoc instance of a multitaper method, and there is a more rigorous application of multitaper methods to the LS periodogram. Not implemented in Python so far as I know, but there is an R implementation. https://iopscience.iop.org/article/10.3847/1538-3881/ab7fa1 -- Robert Kern
On Mon, May 16, 2022 at 11:04 AM Robert Kern <robert.kern@gmail.com> wrote:
I don't know of any work that apply's something like Welch's method per se to the LS periodogram, but if you squint, you can kind of see Welch's method as an ad hoc instance of a multitaper method, and there is a more rigorous application of multitaper methods to the LS periodogram. Not implemented in Python so far as I know, but there is an R implementation.
Looking through this paper more carefully, I see it cites this paper that implements multitaper spectral estimate on regularly-sampled but gappy time series like yours. https://core.ac.uk/download/pdf/237709478.pdf The corresponding MATLAB code is BSD-licensed: https://www.mathworks.com/matlabcentral/fileexchange/71909-mdmwps -- Robert Kern

On 17/05/2022 17:04, Robert Kern wrote:
On Mon, May 16, 2022 at 11:04 AM Robert Kern <robert.kern@gmail.com <mailto:robert.kern@gmail.com>> wrote:
I don't know of any work that apply's something like Welch's method per se to the LS periodogram, but if you squint, you can kind of see Welch's method as an ad hoc instance of a multitaper method, and there is a more rigorous application of multitaper methods to the LS periodogram. Not implemented in Python so far as I know, but there is an R implementation.
https://iopscience.iop.org/article/10.3847/1538-3881/ab7fa1 <https://iopscience.iop.org/article/10.3847/1538-3881/ab7fa1>
Looking through this paper more carefully, I see it cites this paper that implements multitaper spectral estimate on regularly-sampled but gappy time series like yours.
I haven't followed the thread and I haven't looked at the papers, but from this brief problem description is seems that this paper and related papers may be relevant: https://link.springer.com/article/10.1007/s11214-009-9598-2 I may look up articles with possible more details if you are interested. Cheers, Dan
Yes thanks for that link and the software. Will certainly look into porting it into Python. One final question. From this API - https://docs.scipy.org/doc/scipy/reference/signal.windows.html would a Welch window be a welcome addition to that API ? I mean the Bartlett one is basically the precursor of the Welch window. Seems odd that a Welch window is missing. On Tue, May 17, 2022 at 8:35 PM Robert Kern <robert.kern@gmail.com> wrote:
On Mon, May 16, 2022 at 11:04 AM Robert Kern <robert.kern@gmail.com> wrote:
I don't know of any work that apply's something like Welch's method per se to the LS periodogram, but if you squint, you can kind of see Welch's method as an ad hoc instance of a multitaper method, and there is a more rigorous application of multitaper methods to the LS periodogram. Not implemented in Python so far as I know, but there is an R implementation.
Looking through this paper more carefully, I see it cites this paper that implements multitaper spectral estimate on regularly-sampled but gappy time series like yours.
https://core.ac.uk/download/pdf/237709478.pdf
The corresponding MATLAB code is BSD-licensed:
https://www.mathworks.com/matlabcentral/fileexchange/71909-mdmwps
-- Robert Kern _______________________________________________ SciPy-User mailing list -- scipy-user@python.org To unsubscribe send an email to scipy-user-leave@python.org https://mail.python.org/mailman3/lists/scipy-user.python.org/ Member address: winash12@gmail.com
On Tue, May 17, 2022 at 9:28 PM ashwin .D <winash12@gmail.com> wrote:
Yes thanks for that link and the software. Will certainly look into porting it into Python.
One final question. From this API - https://docs.scipy.org/doc/scipy/reference/signal.windows.html would a Welch window be a welcome addition to that API ? I mean the Bartlett one is basically the precursor of the Welch window. Seems odd that a Welch window is missing.
I don't think we're looking to be encyclopedic in our coverage. The initial set we started with (including Bartlett) was mostly to cover what was available in MATLAB at the time. If it's the default window for a particular domain that you can document, that'd be motivation to add it. -- Robert Kern

It is not the most accurate option, but the easiest would be to take the dft (discrete Fourier transform, function is called fft as it chooses the fast version of it can) after linear or quadratic interpolation of your data to a uniform grid. There are ways to compute the Fourier series on a non-uniformed sampled time series (mostly, the response to a specific frequency) but you need to be careful with the results. Treat it as noisy data though, as the interpolation will introduce some noise into the spectrum (it is possible to analyze what kind of noise with some work if it is important, depends what information you hope to get from the output)
On Apr 12, 2022, at 10:34, ashwin .D <winash12@gmail.com> wrote:
Hi Robert, Thanks for your prompt response. I am going to try both. Regarding this answer that you recommended - https://stackoverflow.com/questions/34428886/discrete-fourier-transformation...
what would be my angular frequencies from this API - https://docs.scipy.org/doc/scipy/reference/generated/scipy.signal.lombscargl... ?
The x and y arguments are straightforward and are available to me from the CSV file. What about the third one ?
On Tue, Apr 12, 2022 at 9:48 AM Robert Kern <robert.kern@gmail.com> wrote:
On Mon, Apr 11, 2022 at 11:38 PM ashwin .D <winash12@gmail.com> wrote:
Hello, I have looked at both these answers from SO - https://stackoverflow.com/questions/34428886/discrete-fourier-transformation... and https://stackoverflow.com/questions/25735153/plotting-a-fast-fourier-transfo...
My question is somewhat similar. I have data from a CSV file that has measurements of a mean sea level pressure. The data is available every 5 minutes. That means 8928 sample points over a month. But during a hurricane event there was a power failure and only 8867 data points are available. I am short by 61 points to get a uniformly spaced sample. I am wanting to take an FFT of the data in order to check for periodicity, waves and frequencies there of. What are my best options ?
The first SO answer is reliable (the second is mostly useless for the kind of gap you are talking about); the Lomb-Scargle periodogram is a very reasonable way to do the task. To answer those questions, you will likely want a periodogram, not the more fundamental Fourier transform. But if you do want a full complex-valued Fourier transform for whatever reason, `nfft` should do the job:
https://github.com/jakevdp/nfft/
-- Robert Kern _______________________________________________ SciPy-User mailing list -- scipy-user@python.org To unsubscribe send an email to scipy-user-leave@python.org https://mail.python.org/mailman3/lists/scipy-user.python.org/ Member address: winash12@gmail.com
SciPy-User mailing list -- scipy-user@python.org To unsubscribe send an email to scipy-user-leave@python.org https://mail.python.org/mailman3/lists/scipy-user.python.org/ Member address: laughingrice@gmail.com
participants (4)
-
 ashwin .D
 -
 Daniele Nicolodi
 -
 Micha F
 -
 Robert Kern