
Hello Robert, I am trying to simulate a rectangular block with the fixed bottom and loaded at the top by an area force.
I have following doubts. Please clarify 1.How to consider the area force. 2.Which elastic equation should I use? I am not finding any equation for area loads. 3.I'm sharing my problem description file. Kindly look into it and help me understand. I am very new to SfePy.
from sfepy.mechanics.matcoefs import lame_from_youngpoisson
from sfepy.discrete.fem.utils import refine_mesh
from sfepy import data_dir
# Tell SfePy to use our .mesh file
filename_mesh = data_dir + '/meshes/3d/block.mesh'
# Tell SfePy where u want to save the output
output_dir = '.'
# Material parameters.
young = 200000.0 # Young's modulus [MPa]
poisson = 0.26 # Poisson's ratio
options = {
'output_dir' : output_dir,
}
#Regions are used to define the boundary conditions, the domains of terms and materials etc.
regions = {
'Omega' : 'all',
'Bottom' : ('vertices in (y=0)', 'facet'),
'Top':('vertices in (y=1)', 'facet'),
}
#Define constitutive parameters (e.g. stiffness, permeability, or viscosity),
#Also other non-field arguments of terms (e.g. known traction or volume forces).
materials = {
'Steel' : ({
'lam' : lame_from_youngpoisson(young, poisson)[0],
'mu' : lame_from_youngpoisson(young, poisson)[1],
},),
'Load' : ({'.val' : [0.0, -5.0,0.0]},),
}
#FE field.Here 'real' is datatype,'3' is dof per node, field is defined over omega & '1' is approximation order
fields = {
'displacement': ('real', '3', 'Omega', 1),
}
#Here we use linear elastic spring equation
equations = {
'balance_of_forces' :
"""dw_lin_elastic_iso.2.Omega(Steel.lam, Steel.mu, v, u )
= dw_point_load.0.Top(Load.val, v)""",
}
# Specify the variables that use the FE approximation given by the specified field
variables = {
'u' : ('unknown field', 'displacement', 0),
'v' : ('test field', 'displacement', 'u'),
}
#Since the bottom is fixed corresponding nodal displacement are zero
ebcs = {
'Fixed' : ('Bottom', {'u.all' : 0.0}),
}
#In SfePy, a non-linear solver has to be specified even when solving a linear problem.
#The linear problem is/should be then solved in one iteration of the nonlinear solver
solvers = {
'ls' : ('ls.scipy_direct', {}),
'newton' : ('nls.newton', {
'i_max' : 1,# Number of iterations
'eps_a' : 1e-6,
}),
} Thanks in advance, Nayan M

Hi Nayan,
On 11/23/2015 09:25 PM, nayan...@gmail.com wrote:
Hello Robert, I am trying to simulate a rectangular block with the fixed bottom and loaded at the top by an area force.
I have following doubts. Please clarify 1.How to consider the area force.
Use the dw_surface_ltr term.
2.Which elastic equation should I use? I am not finding any equation for area loads.
Check [1].
3.I'm sharing my problem description file. Kindly look into it and help me understand. I am very new to SfePy.
I have modified your problem description file for the area loads, see the attachment. I have also fixed the region definitions (do not use '=') and the field shape.
Does it help?
r.
[1] http://sfepy.org/doc-devel/examples/linear_elasticity/linear_elastic_tractio...
Robert, Thanks a lot for your help. I was previously using Python(x,y) on my windows. I was getting errors during post processing. Now I want to install SfePy in Ubuntu. Which one would you suggest Python(x,y) or Canopy?
Thanks in advance, Nayan
On Tuesday, November 24, 2015 at 10:37:56 AM UTC+1, Robert Cimrman wrote:
Hi Nayan,
On 11/23/2015 09:25 PM, naya...@gmail.com <javascript:> wrote:
Hello Robert, I am trying to simulate a rectangular block with the fixed bottom and loaded at the top by an area force.
I have following doubts. Please clarify 1.How to consider the area force.
Use the dw_surface_ltr term.
2.Which elastic equation should I use? I am not finding any equation for area loads.
Check [1].
3.I'm sharing my problem description file. Kindly look into it and help me understand. I am very new to SfePy.
I have modified your problem description file for the area loads, see the attachment. I have also fixed the region definitions (do not use '=') and the field shape.
Does it help?
r.
[1]
http://sfepy.org/doc-devel/examples/linear_elasticity/linear_elastic_tractio...
On 11/26/2015 10:19 AM, nayan...@gmail.com wrote:
Robert, Thanks a lot for your help. I was previously using Python(x,y) on my windows. I was getting errors during post processing. Now I want to install SfePy in Ubuntu. Which one would you suggest Python(x,y) or Canopy?
I would use the regular package system - all the packages are there. See [1] - let us know if something is missing there. I do not have a preference in scientific python distributions (not using them personally).
r. [1] http://sfepy.org/doc-devel/installation.html#ubuntu
Thanks in advance, Nayan
On Tuesday, November 24, 2015 at 10:37:56 AM UTC+1, Robert Cimrman wrote:
Hi Nayan,
On 11/23/2015 09:25 PM, naya...@gmail.com <javascript:> wrote:
Hello Robert, I am trying to simulate a rectangular block with the fixed bottom and loaded at the top by an area force.
I have following doubts. Please clarify 1.How to consider the area force.
Use the dw_surface_ltr term.
2.Which elastic equation should I use? I am not finding any equation for area loads.
Check [1].
3.I'm sharing my problem description file. Kindly look into it and help me understand. I am very new to SfePy.
I have modified your problem description file for the area loads, see the attachment. I have also fixed the region definitions (do not use '=') and the field shape.
Does it help?
r.
[1]
http://sfepy.org/doc-devel/examples/linear_elasticity/linear_elastic_tractio...
I am using the regular package now and I got the output. I am confused with the units. What's the unit of stress here? Is it N/M2?
Regards, Nayan
On Friday, November 27, 2015 at 11:24:43 AM UTC+1, Robert Cimrman wrote:
On 11/26/2015 10:19 AM, naya...@gmail.com <javascript:> wrote:
Robert, Thanks a lot for your help. I was previously using Python(x,y) on my windows. I was getting errors during post processing. Now I want to install SfePy in Ubuntu. Which one would you suggest Python(x,y) or Canopy?
I would use the regular package system - all the packages are there. See [1] - let us know if something is missing there. I do not have a preference in scientific python distributions (not using them personally).
r. [1] http://sfepy.org/doc-devel/installation.html#ubuntu
Thanks in advance, Nayan
On Tuesday, November 24, 2015 at 10:37:56 AM UTC+1, Robert Cimrman wrote:
Hi Nayan,
On 11/23/2015 09:25 PM, naya...@gmail.com <javascript:> wrote:
Hello Robert, I am trying to simulate a rectangular block with the fixed bottom
loaded at the top by an area force.
I have following doubts. Please clarify 1.How to consider the area force.
Use the dw_surface_ltr term.
2.Which elastic equation should I use? I am not finding any equation for area loads.
Check [1].
3.I'm sharing my problem description file. Kindly look into it and help me understand. I am very new to SfePy.
I have modified your problem description file for the area loads, see
and the
attachment. I have also fixed the region definitions (do not use '=') and the field shape.
Does it help?
r.
[1]
http://sfepy.org/doc-devel/examples/linear_elasticity/linear_elastic_tractio...
On 11/27/2015 03:30 PM, nayan...@gmail.com wrote:
I am using the regular package now and I got the output. I am confused with the units. What's the unit of stress here? Is it N/M2?
SfePy always uses a consistent unit set, so it is up to you to interpret the units. See also [1].
r.
[1] http://www.continuummechanics.org/cm/techforms/SystemsOfUnits.html
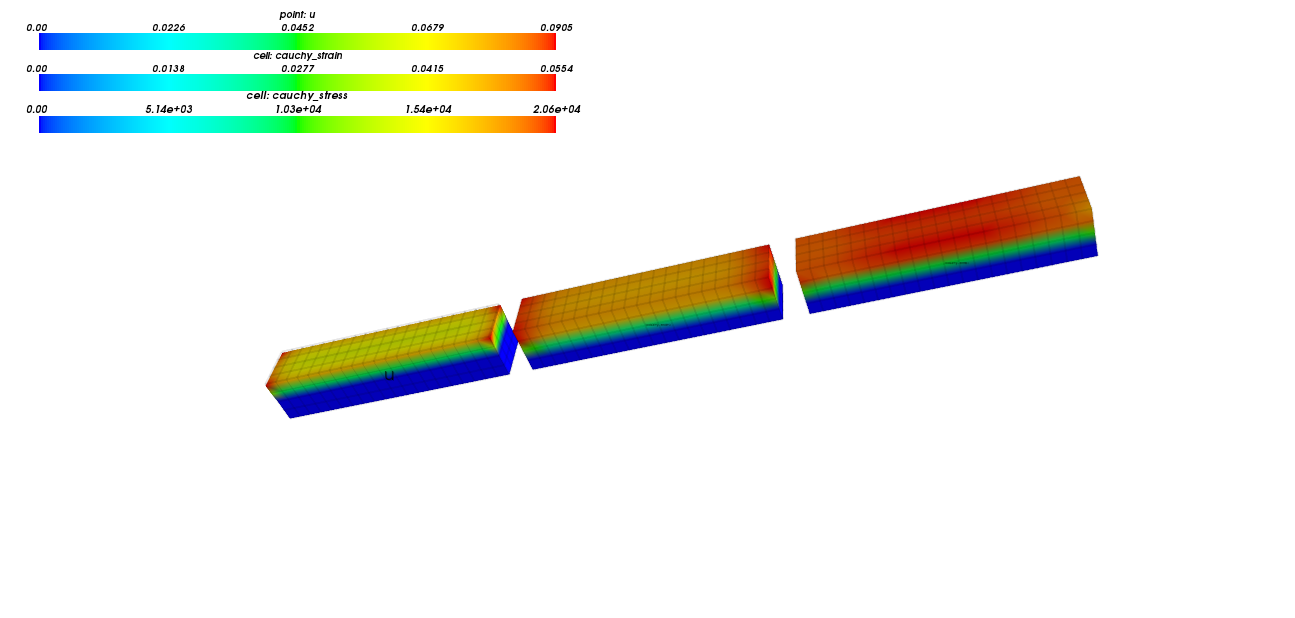
Hi Robert, I calculated displacement, strain and stress for the block under area loading. I am not convinced with the answer. Displacement and strain are maximum at the corners, but stress is maximum in the middle. I think my problem description file is completely messed up.Is it?
Also when I try plot displacement, strain and stress components, one of the components is missing in the graph.
It would be a great help if you could help me. I have attached all the files.
Regards, Nayan
On Friday, November 27, 2015 at 4:55:00 PM UTC+1, Robert Cimrman wrote:
On 11/27/2015 03:30 PM, naya...@gmail.com <javascript:> wrote:
I am using the regular package now and I got the output. I am confused with the units. What's the unit of stress here? Is it N/M2?
SfePy always uses a consistent unit set, so it is up to you to interpret the units. See also [1].
r.
[1] http://www.continuummechanics.org/cm/techforms/SystemsOfUnits.html
Hi Nayan,
when strange things happen, it is usually worth to check your region definitions.
Use:
./simple.py Cuboid_1.py --save-regions-as-groups
and fix the bottom region:
'Bottom' : ('vertices in (y<=-0.9999)', 'facet'),Also, in Cuboid_2.py, replace
stiffness_from_youngpoisson(2, young, poisson)
by (it's 3D problem)
stiffness_from_youngpoisson(3, young, poisson)
Note also, that having the code in the module namespace causes it to be called also before running the simulation (on input file import).
Let me know if that helps.
r.
On 11/28/2015 09:07 PM, nayan...@gmail.com wrote:
Hi Robert, I calculated displacement, strain and stress for the block under area loading. I am not convinced with the answer. Displacement and strain are maximum at the corners, but stress is maximum in the middle. I think my problem description file is completely messed up.Is it?
Also when I try plot displacement, strain and stress components, one of the components is missing in the graph.
It would be a great help if you could help me. I have attached all the files.
Regards, Nayan
On Friday, November 27, 2015 at 4:55:00 PM UTC+1, Robert Cimrman wrote:
On 11/27/2015 03:30 PM, naya...@gmail.com <javascript:> wrote:
I am using the regular package now and I got the output. I am confused with the units. What's the unit of stress here? Is it N/M2?
SfePy always uses a consistent unit set, so it is up to you to interpret the units. See also [1].
r.
[1] http://www.continuummechanics.org/cm/techforms/SystemsOfUnits.html
Robert, I changed " stiffness_from_youngpoisson(2, young, poisson)
by (it's 3D problem)
stiffness_from_youngpoisson(3, young, poisson) "
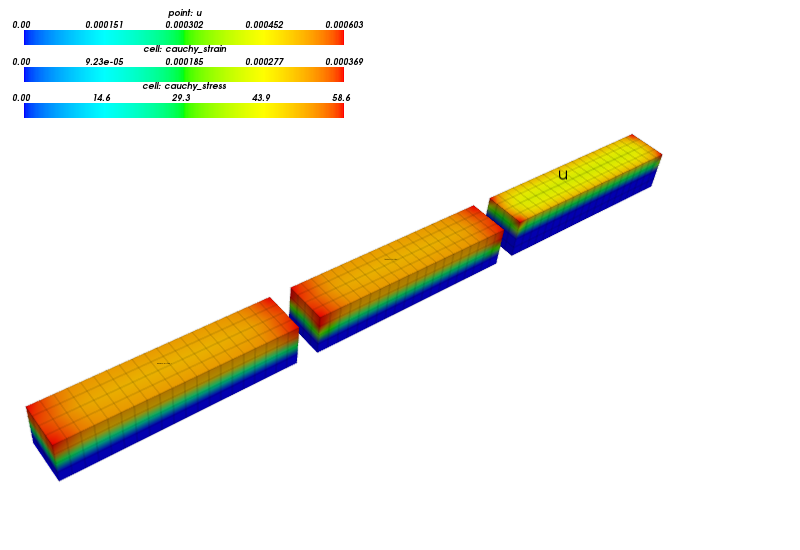
Now it's fixed. (Output is attached, Result).
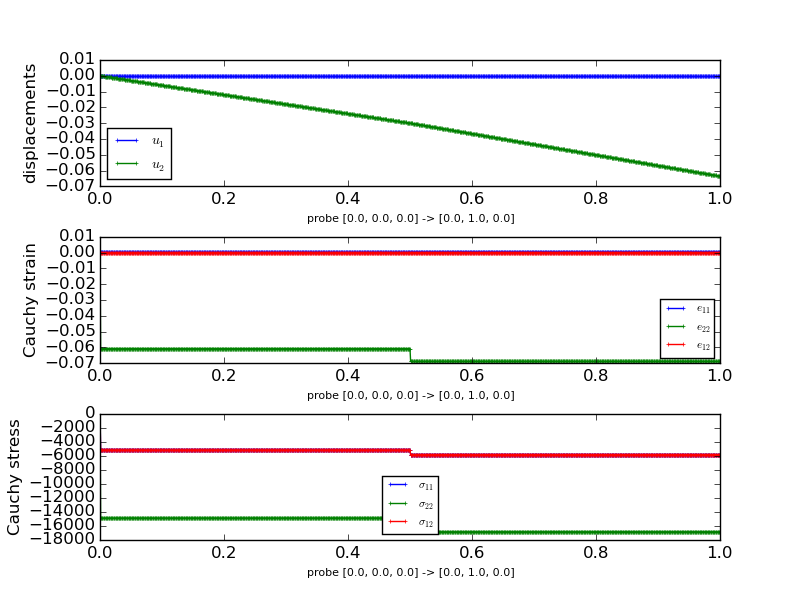
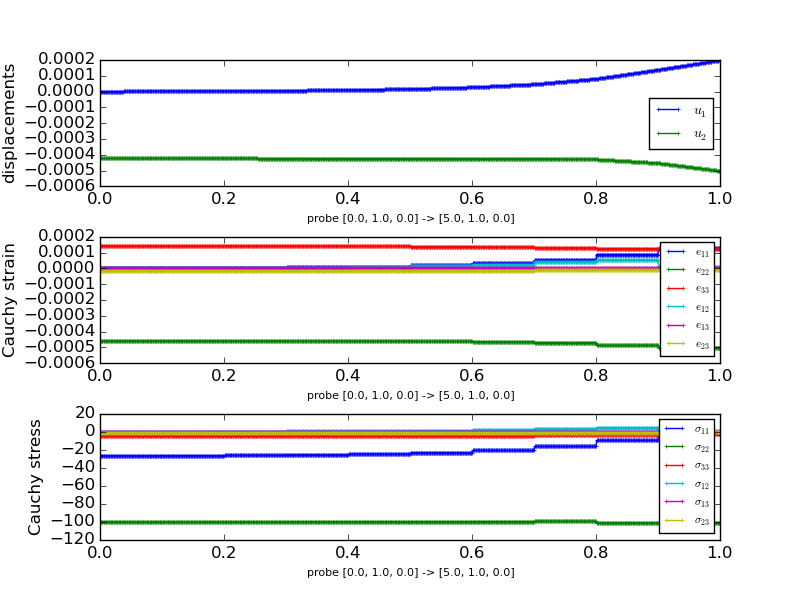
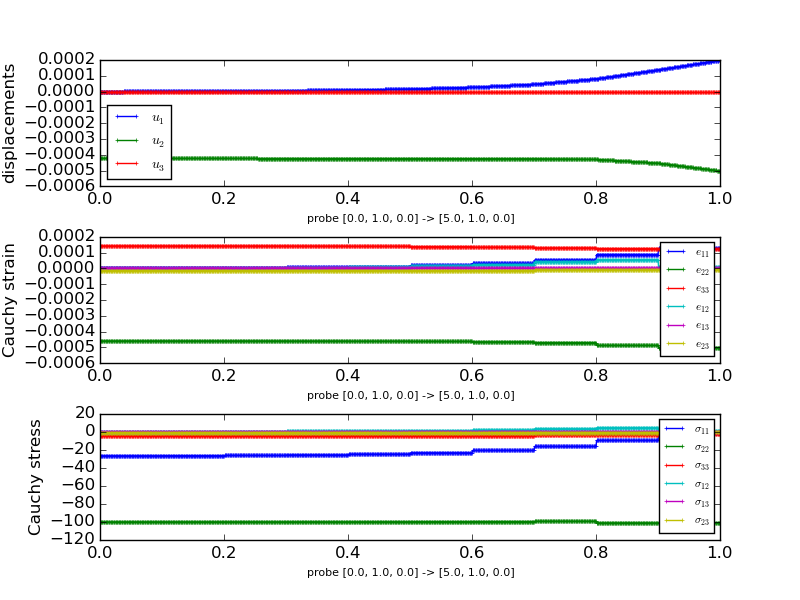
But I tried to plot the displacement, strain and stress only u1 and u2 are on the plot, as per my understanding u1 and u2 are displacements in x and y directions. How do I plot u3 ( displacement in the z direction). I referred its2D_interactive and made changes according to my problem definition. Also at the top surface I want to plot the displacement from x=0 to x=5 but in the plot it is showing only from x=0 to x=1.
Could you please also help me to fix this aswell?
Thanks in advance, Nayan
On Monday, November 30, 2015 at 3:00:23 PM UTC+1, Robert Cimrman wrote:
Hi Nayan,
when strange things happen, it is usually worth to check your region definitions.
Use:
./simple.py Cuboid_1.py --save-regions-as-groups
and fix the bottom region:
'Bottom' : ('vertices in (y<=-0.9999)', 'facet'),Also, in Cuboid_2.py, replace
stiffness_from_youngpoisson(2, young, poisson)
by (it's 3D problem)
stiffness_from_youngpoisson(3, young, poisson)
Note also, that having the code in the module namespace causes it to be called also before running the simulation (on input file import).
Let me know if that helps.
r.
Hi Robert, I calculated displacement, strain and stress for the block under area loading. I am not convinced with the answer. Displacement and strain are maximum at the corners, but stress is maximum in the middle. I think my problem description file is completely messed up.Is it?
Also when I try plot displacement, strain and stress components, one of
On 11/28/2015 09:07 PM, naya...@gmail.com <javascript:> wrote: the
components is missing in the graph.
It would be a great help if you could help me. I have attached all the files.
Regards, Nayan
On Friday, November 27, 2015 at 4:55:00 PM UTC+1, Robert Cimrman wrote:
On 11/27/2015 03:30 PM, naya...@gmail.com <javascript:> wrote:
I am using the regular package now and I got the output. I am confused with the units. What's the unit of stress here? Is it N/M2?
SfePy always uses a consistent unit set, so it is up to you to
interpret
the units. See also [1].
r.
[1] http://www.continuummechanics.org/cm/techforms/SystemsOfUnits.html
On 11/30/2015 03:53 PM, nayan...@gmail.com wrote:
Robert, I changed " stiffness_from_youngpoisson(2, young, poisson)
by (it's 3D problem)
stiffness_from_youngpoisson(3, young, poisson) "
Now it's fixed. (Output is attached, Result).
But I tried to plot the displacement, strain and stress only u1 and u2 are on the plot, as per my understanding u1 and u2 are displacements in x and y directions. How do I plot u3 ( displacement in the z direction). I referred
on line 43 of Cuboid_graph.py, change
for ic in range(vals.shape[1] - 1):to
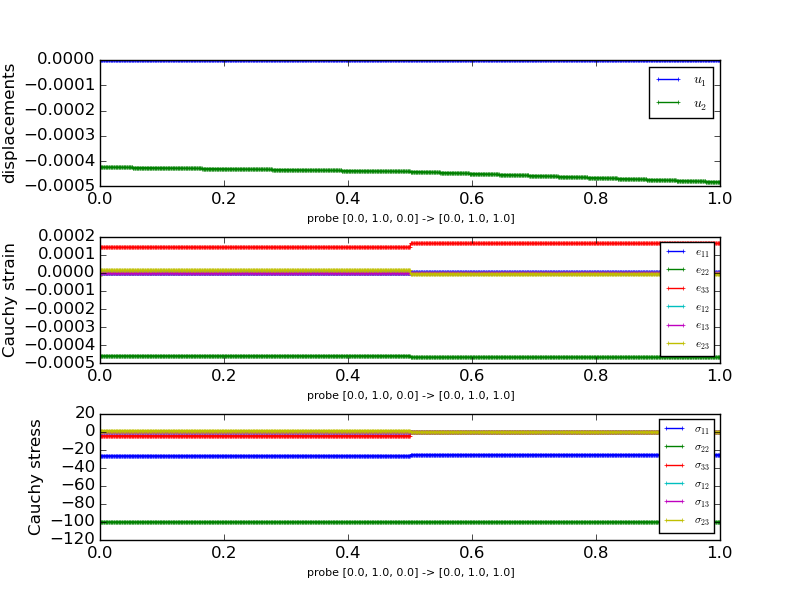
for ic in range(vals.shape[1]):its2D_interactive and made changes according to my problem definition. Also at the top surface I want to plot the displacement from x=0 to x=5 but in the plot it is showing only from x=0 to x=1.
The lines
 ps0 = [[0.0,  1.0, 0.0], [ 0.0, 1.0, 0.0]] # <- starting points
 ps1 = [[5.0,  1.0, 0.0], [ 0.0, 1.0, 1.0]] # <- ending points
mean, that the first probe goes from [0.0, 1.0, 0.0] to [5.0, 1.0, 0.0], and the second from [ 0.0, 1.0, 0.0] to [ 0.0, 1.0, 1.0] - it corresponds to the xlabels in the images. Try fixing that.
r.
Could you please also help me to fix this aswell?
Thanks in advance, Nayan
On Monday, November 30, 2015 at 3:00:23 PM UTC+1, Robert Cimrman wrote:
Hi Nayan,
when strange things happen, it is usually worth to check your region definitions.
Use:
./simple.py Cuboid_1.py --save-regions-as-groups
and fix the bottom region:
'Bottom' : ('vertices in (y<=-0.9999)', 'facet'),Also, in Cuboid_2.py, replace
stiffness_from_youngpoisson(2, young, poisson)
by (it's 3D problem)
stiffness_from_youngpoisson(3, young, poisson)
Note also, that having the code in the module namespace causes it to be called also before running the simulation (on input file import).
Let me know if that helps.
r.
Hi Robert, I calculated displacement, strain and stress for the block under area loading. I am not convinced with the answer. Displacement and strain are maximum at the corners, but stress is maximum in the middle. I think my problem description file is completely messed up.Is it?
Also when I try plot displacement, strain and stress components, one of
On 11/28/2015 09:07 PM, naya...@gmail.com <javascript:> wrote: the
components is missing in the graph.
It would be a great help if you could help me. I have attached all the files.
Regards, Nayan
On Friday, November 27, 2015 at 4:55:00 PM UTC+1, Robert Cimrman wrote:
On 11/27/2015 03:30 PM, naya...@gmail.com <javascript:> wrote:
I am using the regular package now and I got the output. I am confused with the units. What's the unit of stress here? Is it N/M2?
SfePy always uses a consistent unit set, so it is up to you to
interpret
the units. See also [1].
r.
[1] http://www.continuummechanics.org/cm/techforms/SystemsOfUnits.html
Robert, Thanks a lot for your reply. ps0 = [[0.0, 1.0, 0.0], [ 0.0, 1.0, 0.0]] # <- starting points ps1 = [[5.0, 1.0, 0.0], [ 0.0, 1.0, 1.0]] # <- ending points I know the meaning of it. My question was how to plot the displacement at y=1 from x=0 to x=5.
Sorry for asking too my questions. I am new to SfePy.
Regards , Nayan
On Monday, November 30, 2015 at 4:21:22 PM UTC+1, Robert Cimrman wrote:
On 11/30/2015 03:53 PM, naya...@gmail.com <javascript:> wrote:
Robert, I changed " stiffness_from_youngpoisson(2, young, poisson)
by (it's 3D problem)
stiffness_from_youngpoisson(3, young, poisson) "
Now it's fixed. (Output is attached, Result).
But I tried to plot the displacement, strain and stress only u1 and u2 are on the plot, as per my understanding u1 and u2 are displacements in x and y directions. How do I plot u3 ( displacement in the z direction). I referred
on line 43 of Cuboid_graph.py, change
for ic in range(vals.shape[1] - 1):to
for ic in range(vals.shape[1]):its2D_interactive and made changes according to my problem definition. Also at the top surface I want to plot the displacement from x=0 to x=5 but in the plot it is showing only from x=0 to x=1.
The lines
 ps0 = [[0.0,  1.0, 0.0], [ 0.0, 1.0, 0.0]] # <- starting points
 ps1 = [[5.0,  1.0, 0.0], [ 0.0, 1.0, 1.0]] # <- ending points
mean, that the first probe goes from [0.0, 1.0, 0.0] to [5.0, 1.0, 0.0], and the second from [ 0.0, 1.0, 0.0] to [ 0.0, 1.0, 1.0] - it corresponds to the xlabels in the images. Try fixing that.
r.
Could you please also help me to fix this aswell?
Thanks in advance, Nayan
On Monday, November 30, 2015 at 3:00:23 PM UTC+1, Robert Cimrman wrote:
Hi Nayan,
when strange things happen, it is usually worth to check your region definitions.
Use:
./simple.py Cuboid_1.py --save-regions-as-groups
and fix the bottom region:
'Bottom' : ('vertices in (y<=-0.9999)', 'facet'),Also, in Cuboid_2.py, replace
stiffness_from_youngpoisson(2, young, poisson)
by (it's 3D problem)
stiffness_from_youngpoisson(3, young, poisson)
Note also, that having the code in the module namespace causes it to be called also before running the simulation (on input file import).
Let me know if that helps.
r.
On 11/28/2015 09:07 PM, naya...@gmail.com <javascript:> wrote:
Hi Robert, I calculated displacement, strain and stress for the block under
loading. I am not convinced with the answer. Displacement and strain are maximum at the corners, but stress is maximum in the middle. I think my problem description file is completely messed up.Is it?
Also when I try plot displacement, strain and stress components, one of the components is missing in the graph.
It would be a great help if you could help me. I have attached all
area the
files.
Regards, Nayan
On Friday, November 27, 2015 at 4:55:00 PM UTC+1, Robert Cimrman wrote:
On 11/27/2015 03:30 PM, naya...@gmail.com <javascript:> wrote:
I am using the regular package now and I got the output. I am
confused
with
the units. What's the unit of stress here? Is it N/M2?
SfePy always uses a consistent unit set, so it is up to you to interpret the units. See also [1].
r.
[1] http://www.continuummechanics.org/cm/techforms/SystemsOfUnits.html
On 11/30/2015 08:54 PM, nayan...@gmail.com wrote:
Robert, Thanks a lot for your reply. ps0 = [[0.0, 1.0, 0.0], [ 0.0, 1.0, 0.0]] # <- starting points ps1 = [[5.0, 1.0, 0.0], [ 0.0, 1.0, 1.0]] # <- ending points I know the meaning of it. My question was how to plot the displacement at y=1 from x=0 to x=5.
This is done only by (assuming you want x in [0, 5], y = 1, z = 0):
ps0 = [[0.0, 1.0, 0.0]] ps1 = [[5.0, 1.0, 0.0]]
You do not need the second pair of points.
Does it help?
r.
Sorry for asking too my questions. I am new to SfePy.
Regards , Nayan
On Monday, November 30, 2015 at 4:21:22 PM UTC+1, Robert Cimrman wrote:
On 11/30/2015 03:53 PM, naya...@gmail.com <javascript:> wrote:
Robert, I changed " stiffness_from_youngpoisson(2, young, poisson)
by (it's 3D problem)
stiffness_from_youngpoisson(3, young, poisson) "
Now it's fixed. (Output is attached, Result).
But I tried to plot the displacement, strain and stress only u1 and u2 are on the plot, as per my understanding u1 and u2 are displacements in x and y directions. How do I plot u3 ( displacement in the z direction). I referred
on line 43 of Cuboid_graph.py, change
for ic in range(vals.shape[1] - 1):to
for ic in range(vals.shape[1]):its2D_interactive and made changes according to my problem definition. Also at the top surface I want to plot the displacement from x=0 to x=5 but in the plot it is showing only from x=0 to x=1.
The lines
  ps0 = [[0.0,  1.0, 0.0], [ 0.0, 1.0, 0.0]] # <- starting points
  ps1 = [[5.0,  1.0, 0.0], [ 0.0, 1.0, 1.0]] # <- ending points
mean, that the first probe goes from [0.0, 1.0, 0.0] to [5.0, 1.0, 0.0], and the second from [ 0.0, 1.0, 0.0] to [ 0.0, 1.0, 1.0] - it corresponds to the xlabels in the images. Try fixing that.
r.
Could you please also help me to fix this aswell?
Thanks in advance, Nayan
On Monday, November 30, 2015 at 3:00:23 PM UTC+1, Robert Cimrman wrote:
Hi Nayan,
when strange things happen, it is usually worth to check your region definitions.
Use:
./simple.py Cuboid_1.py --save-regions-as-groups
and fix the bottom region:
'Bottom' : ('vertices in (y<=-0.9999)', 'facet'),Also, in Cuboid_2.py, replace
stiffness_from_youngpoisson(2, young, poisson)
by (it's 3D problem)
stiffness_from_youngpoisson(3, young, poisson)
Note also, that having the code in the module namespace causes it to be called also before running the simulation (on input file import).
Let me know if that helps.
r.
On 11/28/2015 09:07 PM, naya...@gmail.com <javascript:> wrote:
Hi Robert, I calculated displacement, strain and stress for the block under
loading. I am not convinced with the answer. Displacement and strain are maximum at the corners, but stress is maximum in the middle. I think my problem description file is completely messed up.Is it?
Also when I try plot displacement, strain and stress components, one of the components is missing in the graph.
It would be a great help if you could help me. I have attached allarea the
files.
Regards, Nayan
On Friday, November 27, 2015 at 4:55:00 PM UTC+1, Robert Cimrman wrote:
On 11/27/2015 03:30 PM, naya...@gmail.com <javascript:> wrote: > I am using the regular package now and I got the output. I am
confused
with > the units. What's the unit of stress here? Is it N/M2?
SfePy always uses a consistent unit set, so it is up to you to interpret the units. See also [1].
r.
[1] http://www.continuummechanics.org/cm/techforms/SystemsOfUnits.html
Should I take out ps1? Did u mean that? I'm really sorry for asking this.
Regards, Nayan
On Monday, November 30, 2015 at 9:13:33 PM UTC+1, Robert Cimrman wrote:
On 11/30/2015 08:54 PM, naya...@gmail.com <javascript:> wrote:
Robert, Thanks a lot for your reply. ps0 = [[0.0, 1.0, 0.0], [ 0.0, 1.0, 0.0]] # <- starting points ps1 = [[5.0, 1.0, 0.0], [ 0.0, 1.0, 1.0]] # <- ending points I know the meaning of it. My question was how to plot the displacement at y=1 from x=0 to x=5.
This is done only by (assuming you want x in [0, 5], y = 1, z = 0):
ps0 = [[0.0, 1.0, 0.0]] ps1 = [[5.0, 1.0, 0.0]]
You do not need the second pair of points.
Does it help?
r.
Sorry for asking too my questions. I am new to SfePy.
Regards , Nayan
On Monday, November 30, 2015 at 4:21:22 PM UTC+1, Robert Cimrman wrote:
On 11/30/2015 03:53 PM, naya...@gmail.com <javascript:> wrote:
Robert, I changed " stiffness_from_youngpoisson(2, young, poisson)
by (it's 3D problem)
stiffness_from_youngpoisson(3, young, poisson) "
Now it's fixed. (Output is attached, Result).
But I tried to plot the displacement, strain and stress only u1 and
u2
are
on the plot, as per my understanding u1 and u2 are displacements in x and y directions. How do I plot u3 ( displacement in the z direction). I referred
on line 43 of Cuboid_graph.py, change
for ic in range(vals.shape[1] - 1):to
for ic in range(vals.shape[1]):its2D_interactive and made changes according to my problem definition. Also at the top surface I want to plot the displacement from x=0 to x=5 but in the plot it is showing only from x=0 to x=1.
The lines
  ps0 = [[0.0,  1.0, 0.0], [ 0.0, 1.0, 0.0]] # <- starting points
  ps1 = [[5.0,  1.0, 0.0], [ 0.0, 1.0, 1.0]] # <- ending points
mean, that the first probe goes from [0.0, 1.0, 0.0] to [5.0, 1.0, 0.0], and the second from [ 0.0, 1.0, 0.0] to [ 0.0, 1.0, 1.0] - it corresponds to the xlabels in the images. Try fixing that.
r.
Could you please also help me to fix this aswell?
Thanks in advance, Nayan
On Monday, November 30, 2015 at 3:00:23 PM UTC+1, Robert Cimrman
Hi Nayan,
when strange things happen, it is usually worth to check your region definitions.
Use:
./simple.py Cuboid_1.py --save-regions-as-groups
and fix the bottom region:
'Bottom' : ('vertices in (y<=-0.9999)', 'facet'),Also, in Cuboid_2.py, replace
stiffness_from_youngpoisson(2, young, poisson)
by (it's 3D problem)
stiffness_from_youngpoisson(3, young, poisson)
Note also, that having the code in the module namespace causes it to
be
called also before running the simulation (on input file import).
Let me know if that helps.
r.
Hi Robert, I calculated displacement, strain and stress for the block under area loading. I am not convinced with the answer. Displacement and strain are maximum at the corners, but stress is maximum in the middle. I think my problem description file is completely messed up.Is it?
Also when I try plot displacement, strain and stress components, one of
On 11/28/2015 09:07 PM, naya...@gmail.com <javascript:> wrote: the
components is missing in the graph.
It would be a great help if you could help me. I have attachedall
wrote: the
files.
Regards, Nayan
On Friday, November 27, 2015 at 4:55:00 PM UTC+1, Robert Cimrman wrote: > > On 11/27/2015 03:30 PM, naya...@gmail.com <javascript:> wrote: >> I am using the regular package now and I got the output. I am confused > with >> the units. What's the unit of stress here? Is it N/M2? > > SfePy always uses a consistent unit set, so it is up to you to interpret > the > units. See also [1]. > > r. > > [1] http://www.continuummechanics.org/cm/techforms/SystemsOfUnits.html >
On 11/30/2015 10:21 PM, nayan...@gmail.com wrote:
Should I take out ps1? Did u mean that? I'm really sorry for asking this.
No, use exactly this:
ps0 = [[0.0, 1.0, 0.0]] ps1 = [[5.0, 1.0, 0.0]]
ps0 is the start point, ps1 is the end point of the line probe.
r.
Regards, Nayan
On Monday, November 30, 2015 at 9:13:33 PM UTC+1, Robert Cimrman wrote:
On 11/30/2015 08:54 PM, naya...@gmail.com <javascript:> wrote:
Robert, Thanks a lot for your reply. ps0 = [[0.0, 1.0, 0.0], [ 0.0, 1.0, 0.0]] # <- starting points ps1 = [[5.0, 1.0, 0.0], [ 0.0, 1.0, 1.0]] # <- ending points I know the meaning of it. My question was how to plot the displacement at y=1 from x=0 to x=5.
This is done only by (assuming you want x in [0, 5], y = 1, z = 0):
ps0 = [[0.0, 1.0, 0.0]] ps1 = [[5.0, 1.0, 0.0]]
You do not need the second pair of points.
Does it help?
r.
Sorry for asking too my questions. I am new to SfePy.
Regards , Nayan
On Monday, November 30, 2015 at 4:21:22 PM UTC+1, Robert Cimrman wrote:
On 11/30/2015 03:53 PM, naya...@gmail.com <javascript:> wrote:
Robert, I changed " stiffness_from_youngpoisson(2, young, poisson)
by (it's 3D problem)
stiffness_from_youngpoisson(3, young, poisson) "
Now it's fixed. (Output is attached, Result).
But I tried to plot the displacement, strain and stress only u1 andu2
are
on the plot, as per my understanding u1 and u2 are displacements in x and y directions. How do I plot u3 ( displacement in the z direction). I referred
on line 43 of Cuboid_graph.py, change
for ic in range(vals.shape[1] - 1):to
for ic in range(vals.shape[1]):its2D_interactive and made changes according to my problem definition. Also at the top surface I want to plot the displacement from x=0 to x=5 but in the plot it is showing only from x=0 to x=1.
The lines
   ps0 = [[0.0,  1.0, 0.0], [ 0.0, 1.0, 0.0]] # <- starting points
   ps1 = [[5.0,  1.0, 0.0], [ 0.0, 1.0, 1.0]] # <- ending points
mean, that the first probe goes from [0.0, 1.0, 0.0] to [5.0, 1.0, 0.0], and the second from [ 0.0, 1.0, 0.0] to [ 0.0, 1.0, 1.0] - it corresponds to the xlabels in the images. Try fixing that.
r.
Could you please also help me to fix this aswell?
Thanks in advance, Nayan
On Monday, November 30, 2015 at 3:00:23 PM UTC+1, Robert Cimrman
Hi Nayan,
when strange things happen, it is usually worth to check your region definitions.
Use:
./simple.py Cuboid_1.py --save-regions-as-groups
and fix the bottom region:
'Bottom' : ('vertices in (y<=-0.9999)', 'facet'),Also, in Cuboid_2.py, replace
stiffness_from_youngpoisson(2, young, poisson)
by (it's 3D problem)
stiffness_from_youngpoisson(3, young, poisson)
Note also, that having the code in the module namespace causes it to
be
called also before running the simulation (on input file import).
Let me know if that helps.
r.
On 11/28/2015 09:07 PM, naya...@gmail.com <javascript:> wrote: > Hi Robert, > I calculated displacement, strain and stress for the block under area > loading. I am not convinced with the answer. Displacement and strain are > maximum at the corners, but stress is maximum in the middle. I think > my problem description file is completely messed up.Is it? > > Also when I try plot displacement, strain and stress components, one of the > components is missing in the graph. > > It would be a great help if you could help me. I have attached all
wrote: the
> files. > > Regards, > Nayan > > On Friday, November 27, 2015 at 4:55:00 PM UTC+1, Robert Cimrman wrote: >> >> On 11/27/2015 03:30 PM, naya...@gmail.com <javascript:> wrote: >>> I am using the regular package now and I got the output. I am confused >> with >>> the units. What's the unit of stress here? Is it N/M2? >> >> SfePy always uses a consistent unit set, so it is up to you to interpret >> the >> units. See also [1]. >> >> r. >> >> [1] http://www.continuummechanics.org/cm/techforms/SystemsOfUnits.html >> >
I am using ps0 = [[0.0, 1.0, 0.0]] ps1 = [[5.0, 1.0, 0.0]] but getting x from 0 to 1, which is something weird. PFA.
Regards, Nayan
On Monday, November 30, 2015 at 11:06:53 PM UTC+1, Robert Cimrman wrote:
Should I take out ps1? Did u mean that? I'm really sorry for asking
On 11/30/2015 10:21 PM, naya...@gmail.com <javascript:> wrote: this.
No, use exactly this:
ps0 = [[0.0, 1.0, 0.0]] ps1 = [[5.0, 1.0, 0.0]]
ps0 is the start point, ps1 is the end point of the line probe.
r.
Regards, Nayan
On Monday, November 30, 2015 at 9:13:33 PM UTC+1, Robert Cimrman wrote:
On 11/30/2015 08:54 PM, naya...@gmail.com <javascript:> wrote:
Robert, Thanks a lot for your reply. ps0 = [[0.0, 1.0, 0.0], [ 0.0, 1.0, 0.0]] # <- starting points ps1 = [[5.0, 1.0, 0.0], [ 0.0, 1.0, 1.0]] # <- ending points I know the meaning of it. My question was how to plot the displacement at y=1 from x=0 to x=5.
This is done only by (assuming you want x in [0, 5], y = 1, z = 0):
ps0 = [[0.0, 1.0, 0.0]] ps1 = [[5.0, 1.0, 0.0]]
You do not need the second pair of points.
Does it help?
r.
Sorry for asking too my questions. I am new to SfePy.
Regards , Nayan
On Monday, November 30, 2015 at 4:21:22 PM UTC+1, Robert Cimrman
On 11/30/2015 03:53 PM, naya...@gmail.com <javascript:> wrote:
Robert, I changed " stiffness_from_youngpoisson(2, young, poisson)
by (it's 3D problem)
stiffness_from_youngpoisson(3, young, poisson) "
Now it's fixed. (Output is attached, Result).
But I tried to plot the displacement, strain and stress only u1and u2
are
on the plot, as per my understanding u1 and u2 are displacements in x and y directions. How do I plot u3 ( displacement in the z direction). I referred
on line 43 of Cuboid_graph.py, change
for ic in range(vals.shape[1] - 1):to
for ic in range(vals.shape[1]):its2D_interactive and made changes according to my problem definition. Also at the top surface I want to plot the displacement from x=0 to x=5 but in the plot it is showing only from x=0 to x=1.
The lines
ps0 = [[0.0, 1.0, 0.0], [ 0.0, 1.0, 0.0]] # <- startingps1 = [[5.0, 1.0, 0.0], [ 0.0, 1.0, 1.0]] # <- ending pointsmean, that the first probe goes from [0.0, 1.0, 0.0] to [5.0, 1.0,
0.0],
and the second from [ 0.0, 1.0, 0.0] to [ 0.0, 1.0, 1.0] - it corresponds to the xlabels in the images. Try fixing that.
r.
Could you please also help me to fix this aswell?
Thanks in advance, Nayan
On Monday, November 30, 2015 at 3:00:23 PM UTC+1, Robert Cimrman
wrote:
> > Hi Nayan, > > when strange things happen, it is usually worth to check your region > definitions. > > Use: > > ./simple.py Cuboid_1.py --save-regions-as-groups > > and fix the bottom region: > > 'Bottom' : ('vertices in (y<=-0.9999)', 'facet'), > > Also, in Cuboid_2.py, replace > > stiffness_from_youngpoisson(2, young, poisson) > > by (it's 3D problem) > > stiffness_from_youngpoisson(3, young, poisson) > > Note also, that having the code in the module namespace causes it to be > called > also before running the simulation (on input file import). > > Let me know if that helps. > > r. > > On 11/28/2015 09:07 PM, naya...@gmail.com <javascript:> wrote: >> Hi Robert, >> I calculated displacement, strain and stress for the block under area >> loading. I am not convinced with the answer. Displacement and strain are >> maximum at the corners, but stress is maximum in the middle. I
wrote: points think
>> my problem description file is completely messed up.Is it? >> >> Also when I try plot displacement, strain and stress components, one of > the >> components is missing in the graph. >> >> It would be a great help if you could help me. I have attached all the >> files. >> >> Regards, >> Nayan >> >> On Friday, November 27, 2015 at 4:55:00 PM UTC+1, Robert Cimrman wrote: >>> >>> On 11/27/2015 03:30 PM, naya...@gmail.com <javascript:> wrote: >>>> I am using the regular package now and I got the output. I am confused >>> with >>>> the units. What's the unit of stress here? Is it N/M2? >>> >>> SfePy always uses a consistent unit set, so it is up to you to > interpret >>> the >>> units. See also [1]. >>> >>> r. >>> >>> [1] http://www.continuummechanics.org/cm/techforms/SystemsOfUnits.html >>> >> > >
On 12/01/2015 08:02 AM, nayan...@gmail.com wrote:
I am using ps0 = [[0.0, 1.0, 0.0]] ps1 = [[5.0, 1.0, 0.0]] but getting x from 0 to 1, which is something weird. PFA.
Regards, Nayan
You only seem to wrongly read the figure legend. As I can see it, x is from 0 (the first item in the first []) to 5 (the first item in the second []).
The legend is as: [x0, y0, z0] -> [x1, y1, z1], meaning point0 -> point1
Cheers, r.
participants (2)
-
 nayan...@gmail.com
 -
 Robert Cimrman